M365 Log Management (4): Building a Windows Update Dashboard from WUFB (Intune + Log Analytics + Power BI)
M365 Log Management (4): Building a Windows Update Dashboard from Update History (Intune + Log Analytics + Power BI)
Recently, I’ve been getting more and more interested in visualizing operational logs and device records in a Power BI dashboard. In the Microsoft ecosystem, one of the biggest advantages is that the reporting and data pipelines are designed by the same vendor that built the platform, which often makes the integration more efficient than many third‑party approaches.
At first, I considered pulling everything with PowerShell, but I found that Intune policies + Log Analytics can load the relevant Windows Update signals with far less friction—and then you can build a dashboard on top of them quickly.
This post walks through how to create a Windows Update dashboard using Windows Update for Business reports, Azure Log Analytics, and a Power BI template.
Youtube: https://youtu.be/ToqAFJpoh_g
What You’ll Need (Requirements)
To build the dashboard described here, you’ll need:
- An Azure subscription
- A Log Analytics workspace
- Devices enrolled and managed with Microsoft Intune
- Power BI Desktop (to open the template and customize the report)
Reference Materials (Official/Community)
These were the key resources used while implementing the solution:
- Windows Update for Business reports overview - Windows Update for Business reports | Microsoft Learn
- Tailor Windows Update for Business reports with Power BI | Windows IT Pro Blog
- Configure devices using Microsoft Intune - Windows Update for Business reports | Microsoft Learn
High-Level Flow (How the Data Gets to Your Dashboard)
At a high level, the process looks like this:
- Intune policy enables required diagnostic/telemetry settings on devices
- Windows Update for Business reports is enabled and connected to your Log Analytics workspace
- Devices upload update status signals → stored in Log Analytics tables (e.g., tables prefixed with
UC*) - A Power BI template queries the Log Analytics workspace and visualizes update health
Step 1) Configure Intune Devices for Windows Update for Business Reports
This step ensures that devices can send the required diagnostic data (including device name, if needed for reporting clarity). I followed the Microsoft Learn guidance and created a configuration policy using the Settings catalog. 1.%20Windows%20Update%20%EA%B8%B0%EB%A1%9D%EC%9D%84%20%ED%86%B5%ED%95%9C%20%EB%8C%80%EC%8B%9C%EB%B3%B4%EB%93%9C%20%EB%A7%8C%EB%93%A4%EA%B8%B0.loop)
1. Create a Configuration Profile
In Intune admin center:
Devices → Windows
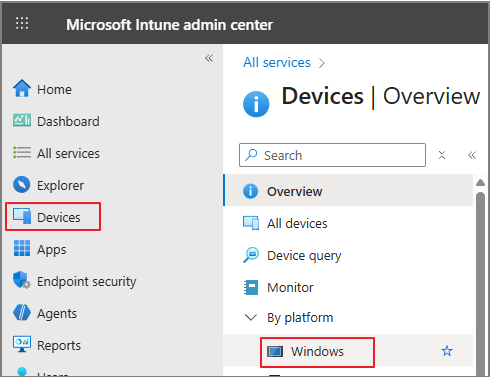
Configuration → Policies → New policy

Platform: Windows 10 and later | Profile type: Settings catalog

Create the profile and give it a name (example used: AllowDeviceNameInDiagnosticData)
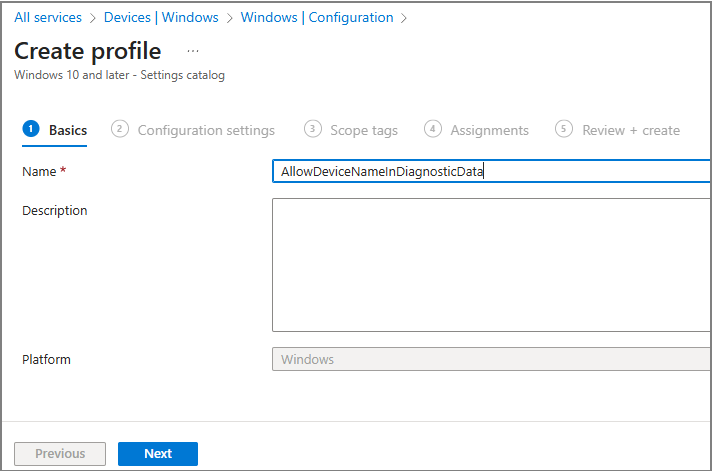
2. Add Required Settings
In the Settings catalog, search and add the following:

- Allow Telemetry
- Category: System
- Value: Basic
- Configure Telemetry Opt In Settings UX
- Value: Disabled
- Configure Telemetry Opt In Change Notification
- Value: Disabled
- Allow device name to be sent in Windows diagnostic data
- Value: Allowed

3. Assign and Monitor the Policy
- Assign the profile to the target users/devices

- Complete Review + create

- Monitor the deployment status in Intune to confirm devices are checking in successfully

Step 2) Enable Windows Update for Business Reports and Connect Log Analytics
Once devices are ready, you need to enable Windows Update for Business reports and link it to your Azure subscription and Log Analytics workspace.
1. Open the Built-In Workbook in Azure
In Azure Portal:
- Go to Monitor

- Select Workbooks > Choose Windows Update for Business reports

- Click Get started

2. Configure Enrollment (Subscription + Workspace)
- Select your Azure subscription & Log Analytics workspace > Save settings
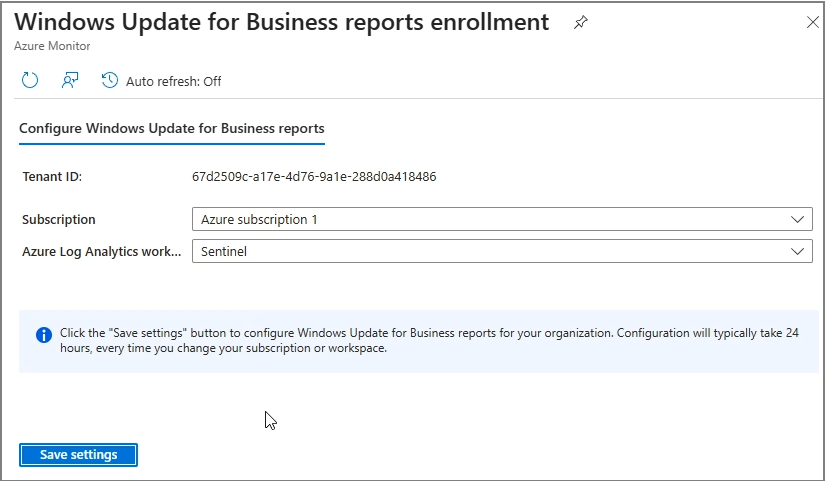
During this flow, you can see that configuration is handled through Microsoft Graph (the UI surfaces the Graph endpoint being called).
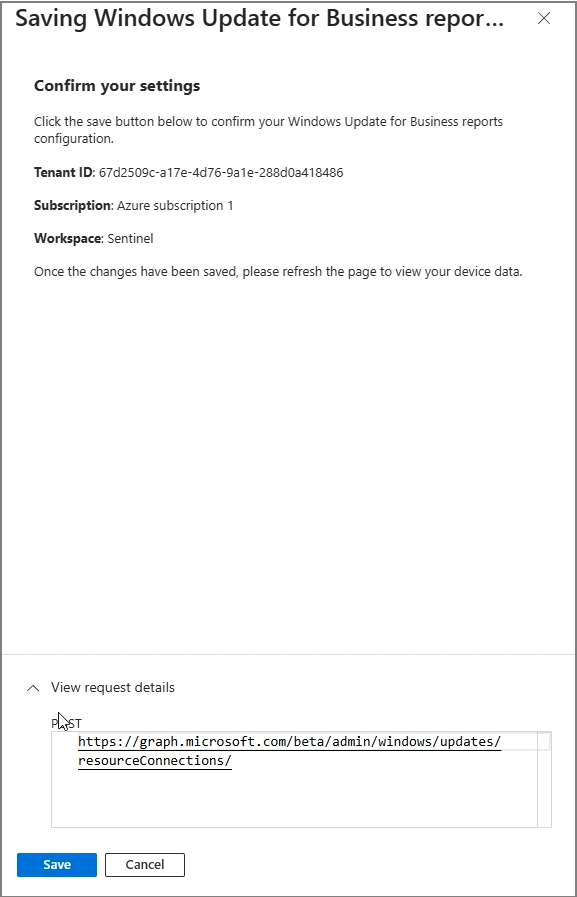
3. Wait for Data to Populate
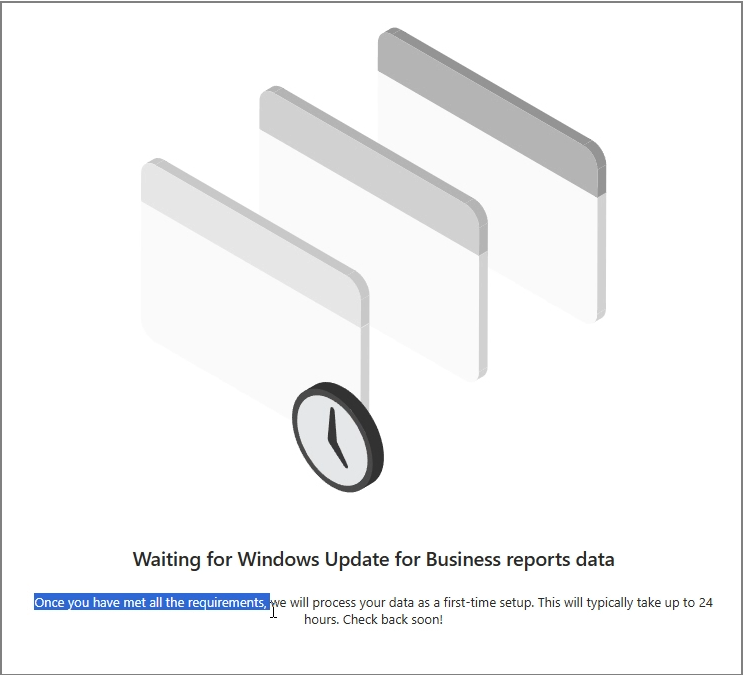
The UI mentions it may take up to 24 hours, but in my case it took 48+ hours before data appeared.
4. Confirm Data in Log Analytics
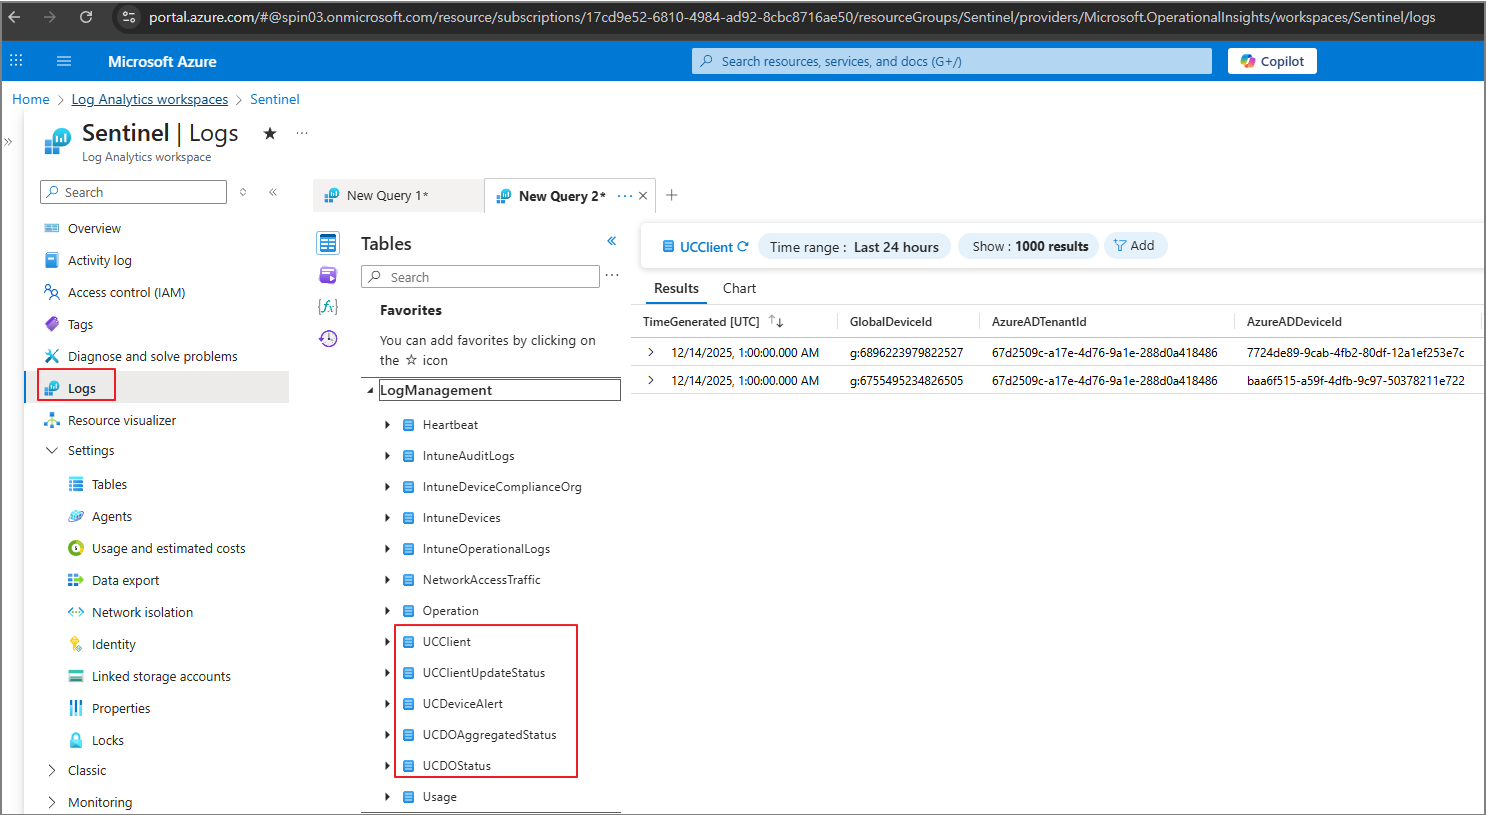
In Log Analytics, the data lands in tables that start with UC (for example, multiple UC* tables will appear once ingestion begins).
5. Understand Collection / Upload Frequency
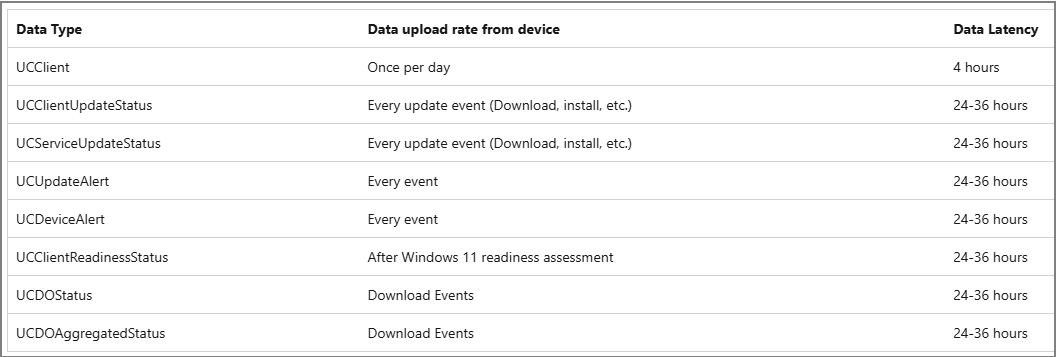
Microsoft documentation also lists data types and upload frequency/latency. Practically speaking, you should expect some tables/events to arrive on different cadences (some daily, some per update event, and with latency that can span hours to a day or more).
Step 3) Tailor the Reports with Power BI
Once data is available in Log Analytics, the easiest path to a polished dashboard is to use the official Power BI template published for Windows Update for Business reports.
1. Download the Power BI Template
From the Tech Community / Windows IT Pro blog post, download the Power BI template referenced in the guide.
Tailor Windows Update for Business reports with Power BI | Windows IT Pro Blog

2. Copy the Workspace ID
In Azure Portal:
- Open Log Analytics workspaces

- Copy the Workspace ID

3. Open the Template and Load Data
- Open the Power BI template file
- When prompted, paste the Workspace ID

- Click Load
4. Authenticate
When Power BI prompts for access to the Log Analytics endpoint:
- Choose Organizational account

- Click Connect
5. View Your Windows Update Dashboard
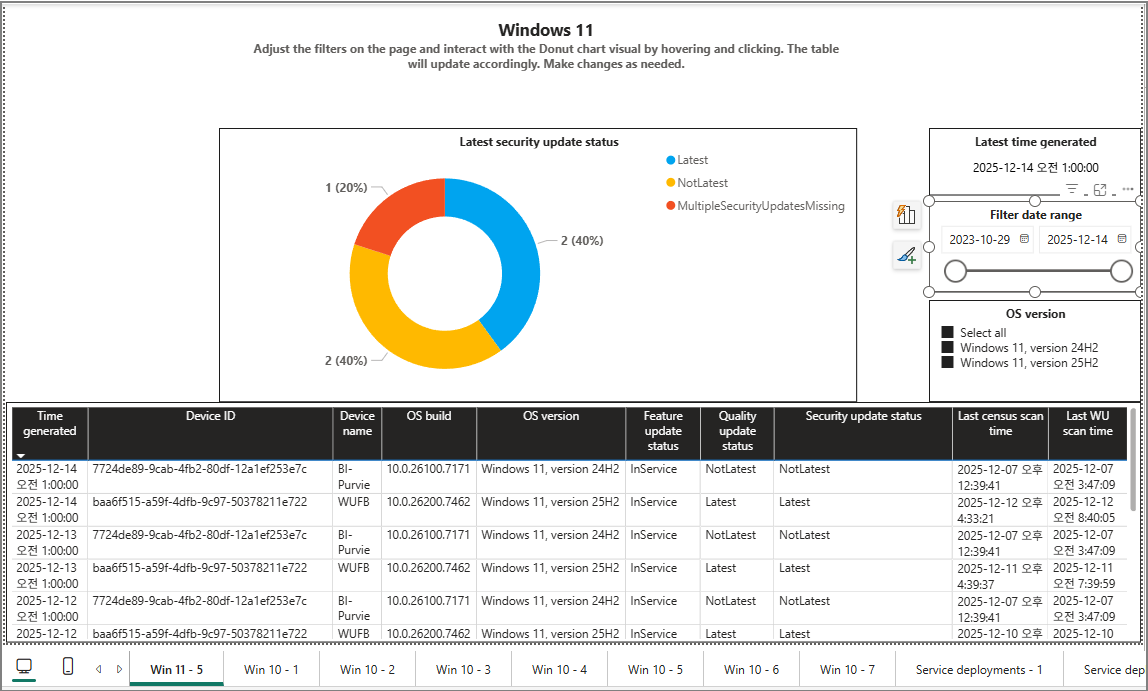
After authentication completes and data is loaded, the dashboard visuals populate and you can begin customizing pages, KPIs, filters, and device group views.
Wrap-Up
With just Intune, Log Analytics, and the Power BI template, you can build a practical Windows Update dashboard without writing custom scripts or maintaining a separate data pipeline. The key is getting device diagnostics configured correctly, enabling WUfB reports, and allowing enough time for ingestion to stabilize.