Many IT engineers and managers are unaware that if your Hyper-V host server is running Windows Server Datacenter Edition, you can use AVMA (Automatic Virtual Machine Activation) keys to automatically activate guest VMs. Leveraging this feature simplifies the activation process and makes management much easier.
In this post, I’ll walk you through how AVMA works, how to use it, and some practical tips for automating Windows Server VM activation on Hyper-V.
Youtube: https://youtu.be/deyWNdW6S-U
What is AVMA?
AVMA (Automatic Virtual Machine Activation) allows you to activate Windows Server virtual machines running on a Datacenter edition Hyper-V host without needing to enter a product key for each VM. This is especially useful for environments where you frequently deploy or redeploy VMs.
Reference:
Automatic Virtual Machine Activation in Windows Server | Microsoft Learn
- Guest VM: The version of Windows Server you can activate depends on the host OS version.
Supported Host and Guest Combinations

For example, if your host is Windows Server 2025, you can activate guest VMs from 2012 R2 up to 2025 using AVMA keys.
AVMA Keys for Each Windows Server Version
You can find the official AVMA keys in Microsoft’s documentation. Here are some examples:

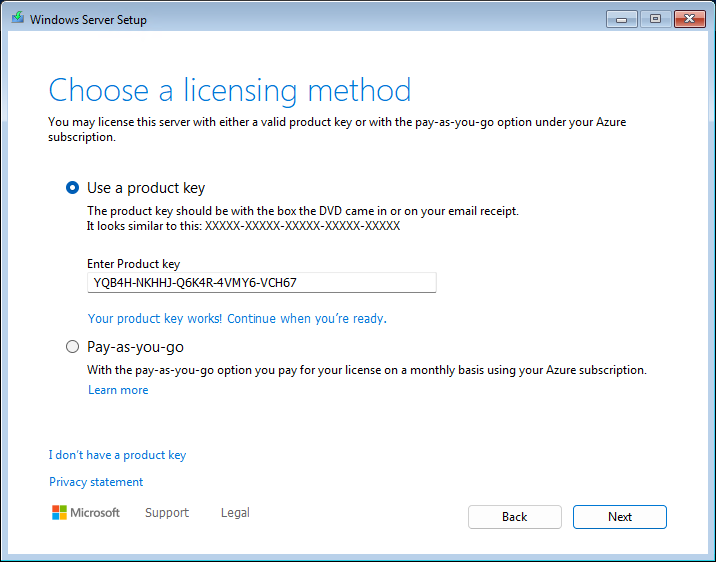
How to Use AVMA Keys During Installation
When installing Windows Server as a VM on your Hyper-V Datacenter host, you can enter the AVMA key during setup:
Choose a licensing method:
Select “Use a product key” and enter the AVMA key for your OS version.
Select the image:
The installer will recognize the OS version that matches the AVMA key.

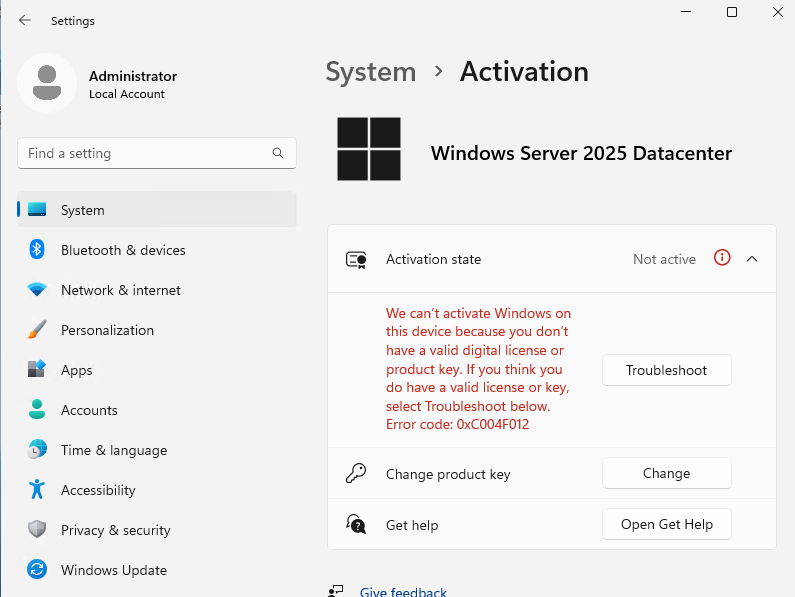
Post-Installation Activation
After installation, you might notice that Windows is not yet activated. Here’s how to proceed:
Check Activation Status:
Go to Start > Settings > System > Activation. If not activated, you may see an error (e.g., 0xC004F012).
Activate via Command Line:
Open PowerShell or Command Prompt as Administrator and run:
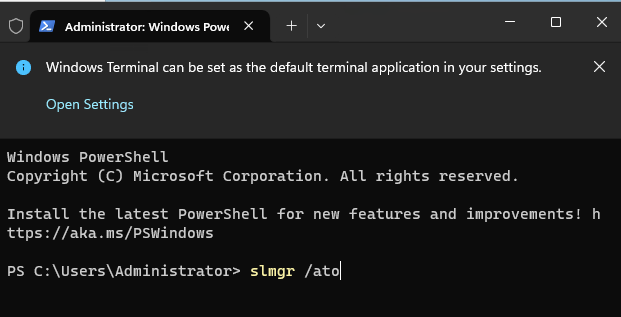
This will trigger activation using the AVMA key.
Verify Activation:
The activation state should now show as “Active”.

Activating an Already Installed VM
If you’ve already installed the OS without entering a key, you can still activate:
Go to System Settings:
Start > System > About > Product key and activation.
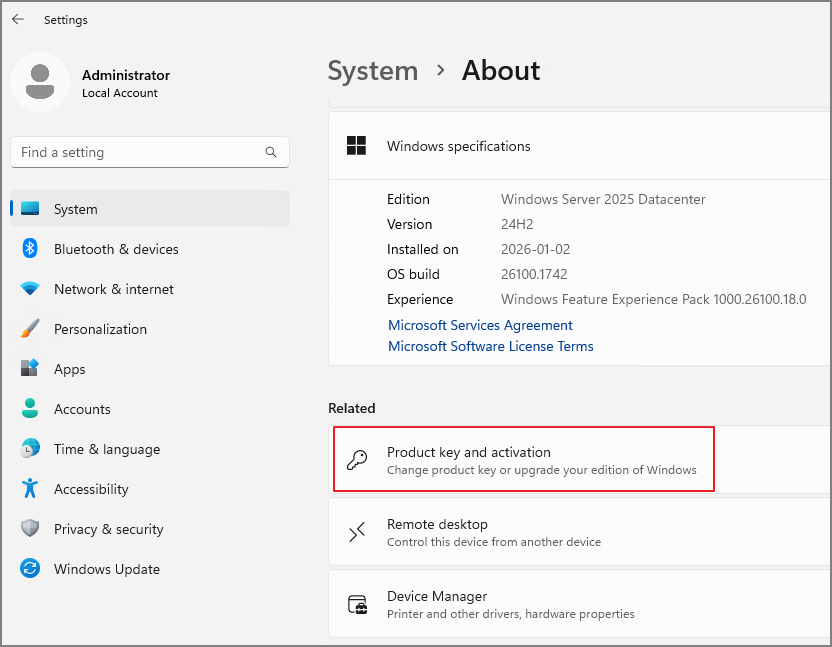
Change Product Key:
Enter the appropriate AVMA key and proceed with activation.

Next

Activate

Pro Tip: Using Sysprep
After completing activation, running Sysprep is highly recommended for managing test environments efficiently. This avoids repetitive product key entry and ensures your template VMs are ready for rapid deployment.
Conclusion
AVMA is a powerful feature for anyone managing Windows Server VMs on Hyper-V Datacenter hosts. It streamlines activation, reduces manual work, and helps maintain compliance. Make sure to use the correct AVMA key for your guest OS version, and enjoy hassle-free VM deployments!
'Windows Server' 카테고리의 다른 글
| ADFS & WAP. Upgrade & Migration From 2022 to 2025 (Ver. Eng) (1) | 2025.07.12 |
|---|---|
| Windows Server 2025. Configure Active Directory(AD) Domain Controller(DC) (1) | 2024.12.15 |
| Windows Server 2025. Domain Controller upgrade From 2022 to 2025 (English) (0) | 2024.11.16 |
| Windows Server 2025. Install & Sysprep (0) | 2024.11.09 |