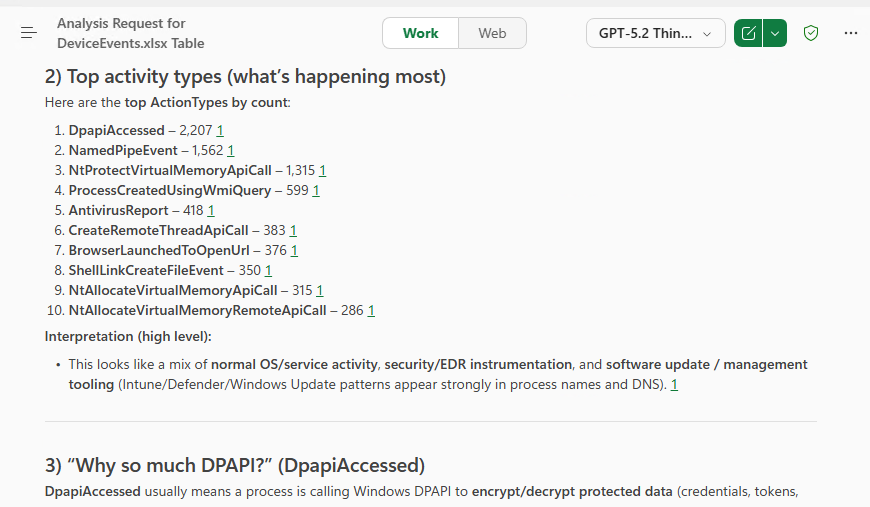
While doing a self-study to compare Endpoint DLP logs against Microsoft Defender for Endpoint (MDE) logs, I ran into a practical issue: in Power BI, reorganizing column order can be surprisingly annoying when you just want to quickly compare a few fields side by side.
After digging in, I found a very handy trick:
✅ You can take the M Query exported from Sentinel/Log Analytics and paste it directly into Excel Power Query—and it works.
If you do analysis primarily in Excel (filters, quick comparisons, pivot tables), this approach is super practical.
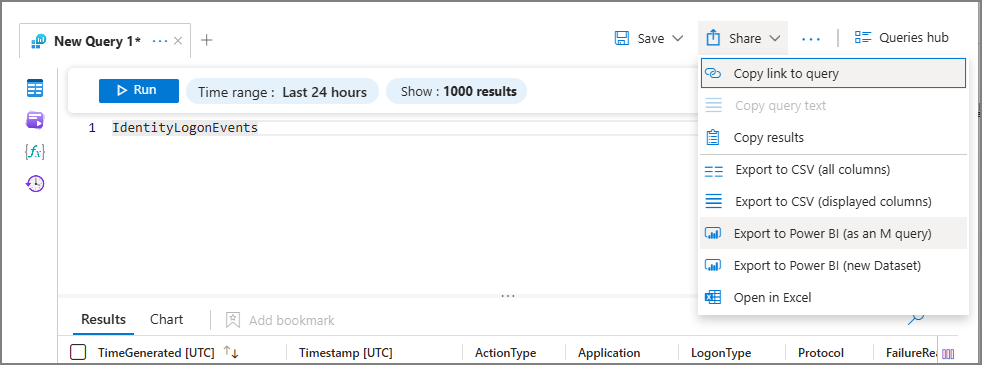
In Sentinel / Log Analytics, export your query using Export to Power BI (as an M query).
In Excel, open Power Query (Blank Query) and paste the M Query into the Advanced Editor.
Authenticate using Organizational account, then Close & Load to load it into a worksheet table.
From then on, just hit Refresh to update logs—no more re-running the same query in the portal.
Step 1) Export the M Query from Sentinel / Log Analytics
In the Azure Portal, navigate to either:
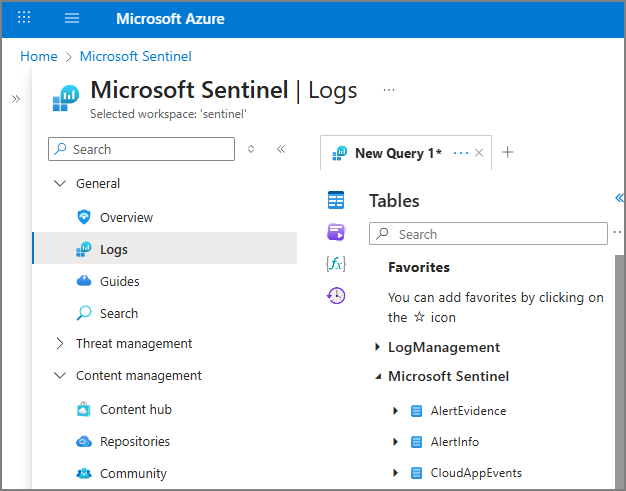
Microsoft Sentinel > Logs
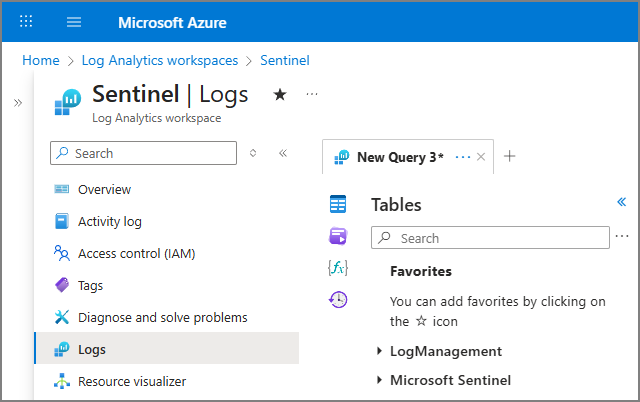
Log Analytics Workspace > Logs
Write or select the query for the table > Setting Time range > Share > Export to Power BI (as an M query)
Step 2) Connect to Log Analytics Using M Query in Excel
2-1) Create a Blank Query
In Excel:
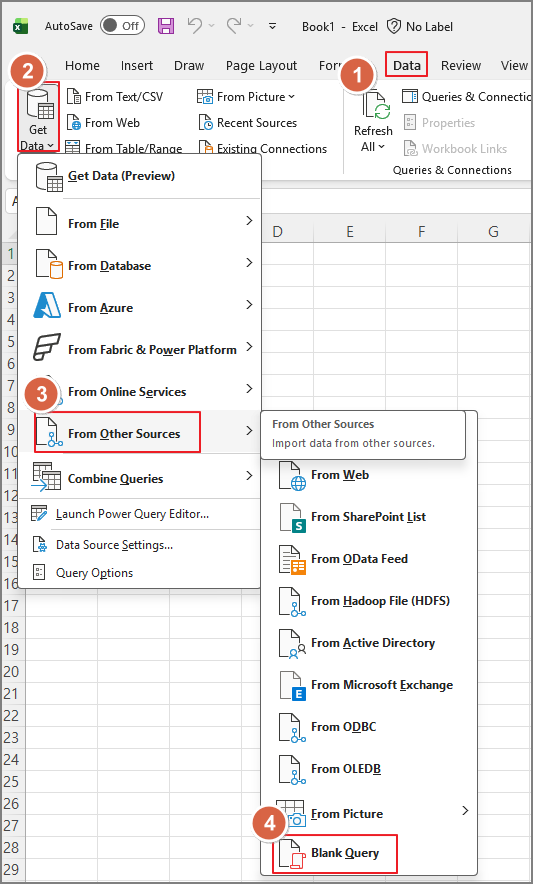
Data > Get Data > From Other Sources > Blank Query
2-2) Paste the M Query into Advanced Editor
In the Power Query Editor:
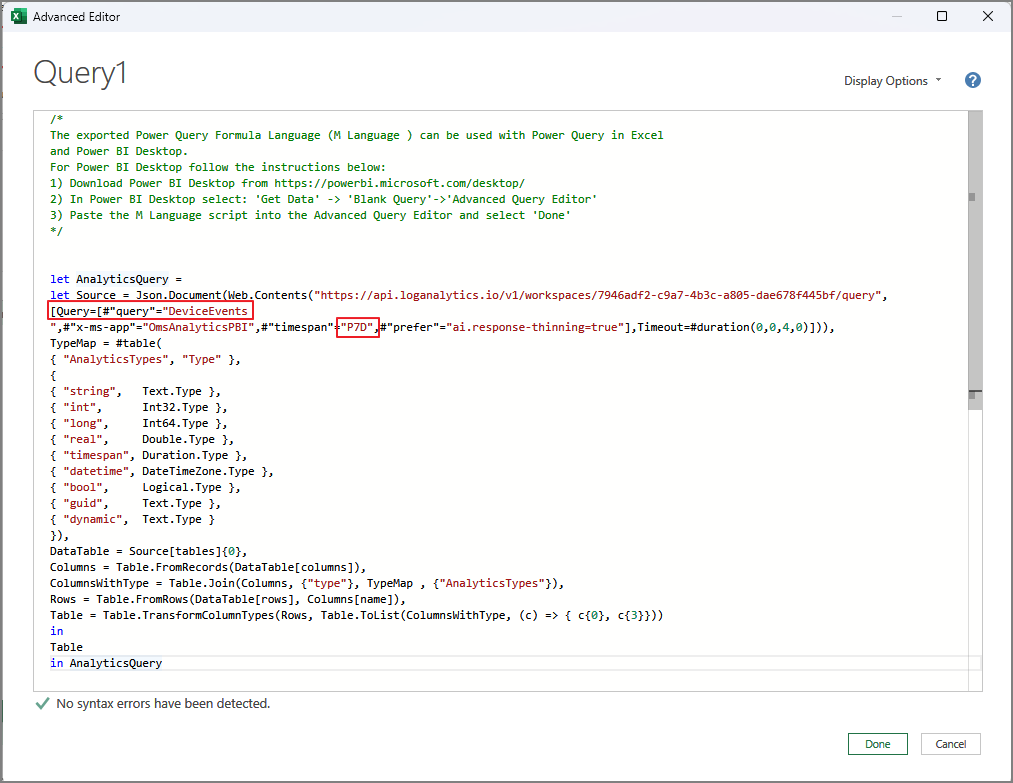
Open Advanced Editor
Paste the entire M Query you downloaded in Step 1 as-is
A typical exported M Query includes things like:
The target table
The query time range
✅ Pro tip: If you need to connect multiple tables, just duplicate the query and update only the table name and time span section. It’s the fastest way to scale your workbook.
2-3) Configure Credentials (Authentication)
On first connection, you may see Edit Credentials.
Organizational account → sign in → Connect
2-4) Load to Excel and Refresh Anytime
Before loading:
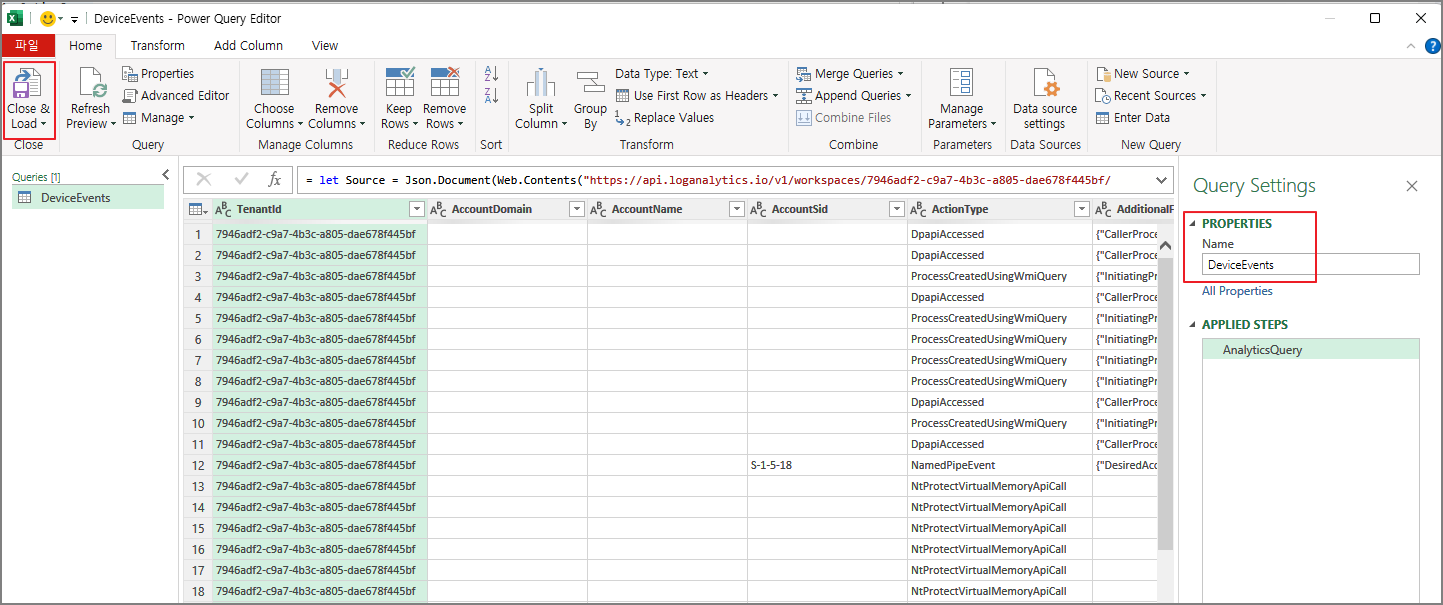
Rename the query to something meaningful
Then choose Close & Load to load into an Excel worksheet table
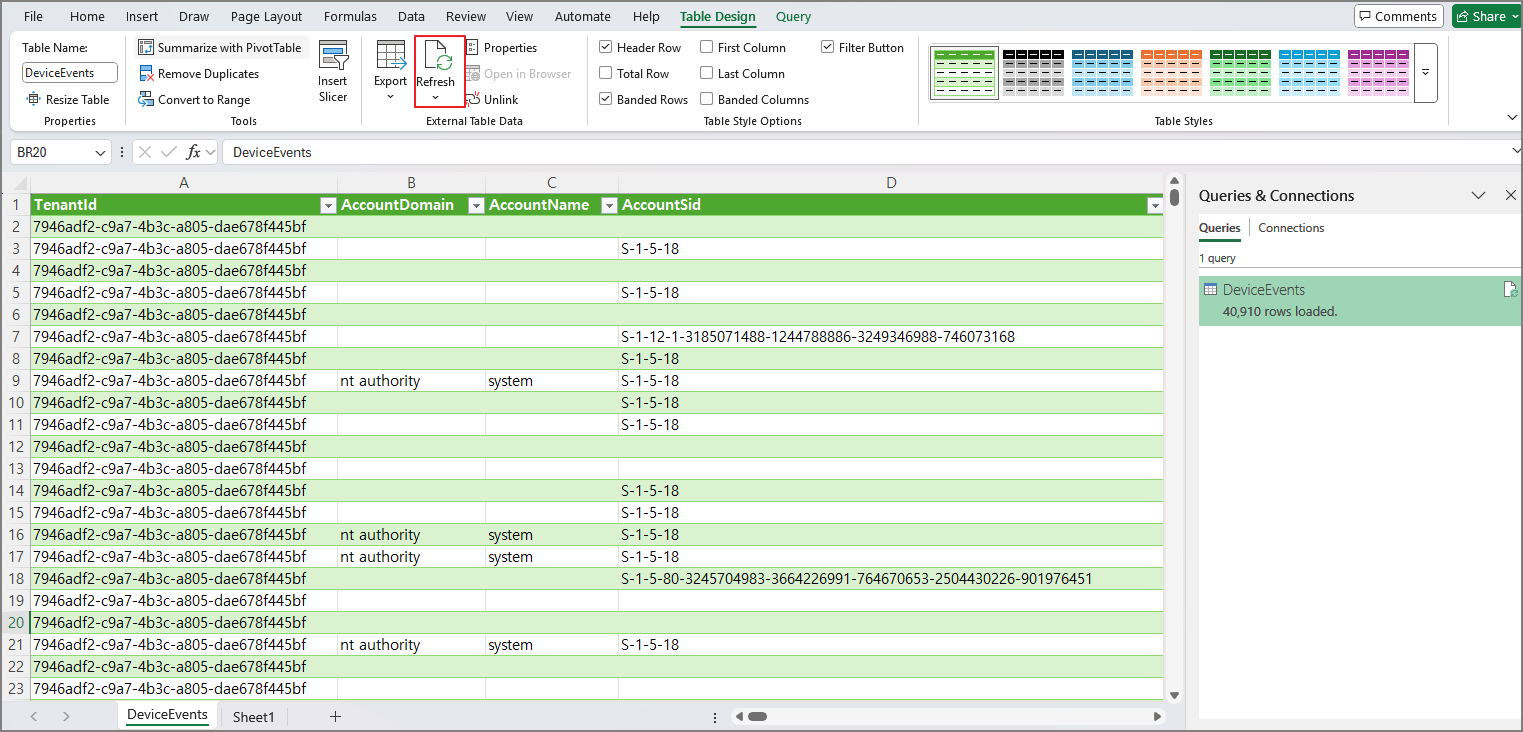
Use filters, sorting, pivots, conditional formatting, side-by-side comparisons… all the Excel stuff that’s great for fast investigation.
And the best part:
✅ Refresh updates the dataset without re-running the whole process in the portal.
Step 3) Bonus: Analyze Logs with Copilot (Excel + OneDrive/SharePoint)
After loading logs into Excel:
Save the workbook to OneDrive or SharePoint
Ask Copilot to analyze the data
If Copilot recognizes your tables (for example, MDE-related tables), it can quickly do things like:
Summaries
Trend analysis
Outlier/anomaly detection
Quick insights and narrative explanations
Wrap-up
Using M Query Export from Sentinel/Log Analytics isn’t just for Power BI—you can connect it directly to Excel and build a refreshable log analysis workbook.
If your workflow is centered on:
Fast comparison
Column reordering
Filtering
Pivot-based analysis
…then Excel can be the more efficient tool. And once the dataset is in OneDrive/SharePoint, Copilot becomes an extra boost for rapid investigation.
M365 Log Management (4): Building a Windows Update Dashboard from Update History (Intune + Log Analytics + Power BI)
Recently, I’ve been getting more and more interested in visualizing operational logs and device records in a Power BI dashboard. In the Microsoft ecosystem, one of the biggest advantages is that the reporting and data pipelines are designed by the same vendor that built the platform, which often makes the integration more efficient than many third‑party approaches.
At first, I considered pulling everything with PowerShell, but I found that Intune policies + Log Analytics can load the relevant Windows Update signals with far less friction—and then you can build a dashboard on top of them quickly.
This post walks through how to create a Windows Update dashboard using Windows Update for Business reports, Azure Log Analytics, and a Power BI template.
High-Level Flow (How the Data Gets to Your Dashboard)
At a high level, the process looks like this:
Intune policy enables required diagnostic/telemetry settings on devices
Windows Update for Business reports is enabled and connected to your Log Analytics workspace
Devices upload update status signals → stored in Log Analytics tables (e.g., tables prefixed with UC*)
A Power BI template queries the Log Analytics workspace and visualizes update health
Step 1) Configure Intune Devices for Windows Update for Business Reports
This step ensures that devices can send the required diagnostic data (including device name, if needed for reporting clarity). I followed the Microsoft Learn guidance and created a configuration policy using the Settings catalog. 1.%20Windows%20Update%20%EA%B8%B0%EB%A1%9D%EC%9D%84%20%ED%86%B5%ED%95%9C%20%EB%8C%80%EC%8B%9C%EB%B3%B4%EB%93%9C%20%EB%A7%8C%EB%93%A4%EA%B8%B0.loop)
1. Create a Configuration Profile
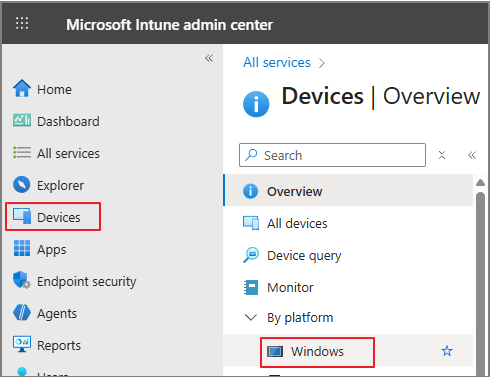
In Intune admin center:
Devices → Windows
Configuration → Policies → New policy
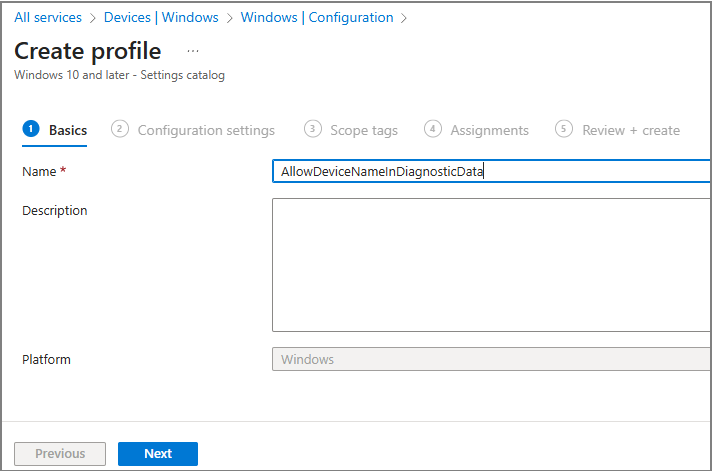
Platform: Windows 10 and later | Profile type:Settings catalog
Create the profile and give it a name (example used: AllowDeviceNameInDiagnosticData)
2. Add Required Settings
In the Settings catalog, search and add the following:
Allow Telemetry
Category: System
Value: Basic
Configure Telemetry Opt In Settings UX
Value: Disabled
Configure Telemetry Opt In Change Notification
Value: Disabled
Allow device name to be sent in Windows diagnostic data
Value: Allowed
3. Assign and Monitor the Policy
Assign the profile to the target users/devices
Complete Review + create
Monitor the deployment status in Intune to confirm devices are checking in successfully
Step 2) Enable Windows Update for Business Reports and Connect Log Analytics
Once devices are ready, you need to enable Windows Update for Business reports and link it to your Azure subscription and Log Analytics workspace.
1. Open the Built-In Workbook in Azure
In Azure Portal:
Go to Monitor
Select Workbooks > Choose Windows Update for Business reports
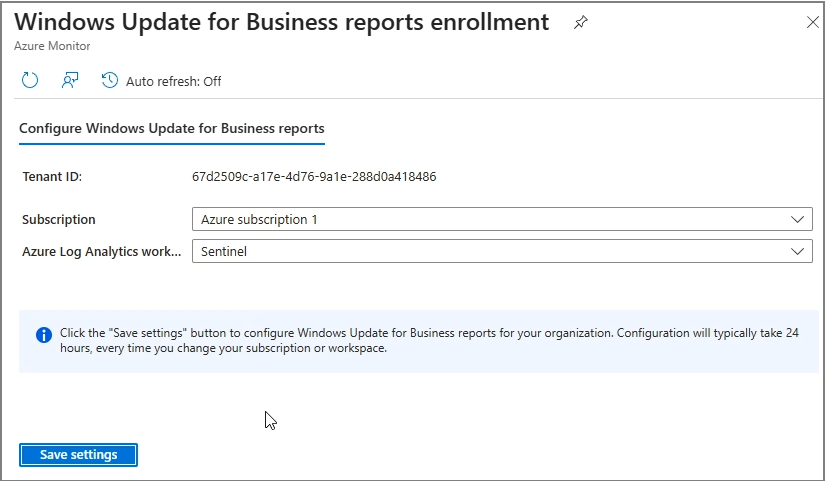
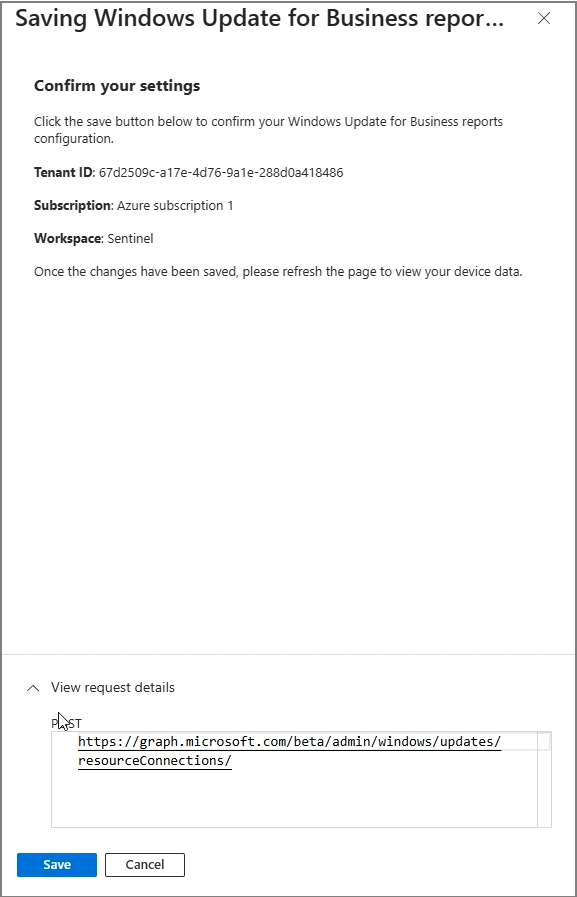
Select your Azure subscription & Log Analytics workspace > Save settings
During this flow, you can see that configuration is handled through Microsoft Graph (the UI surfaces the Graph endpoint being called).
3. Wait for Data to Populate
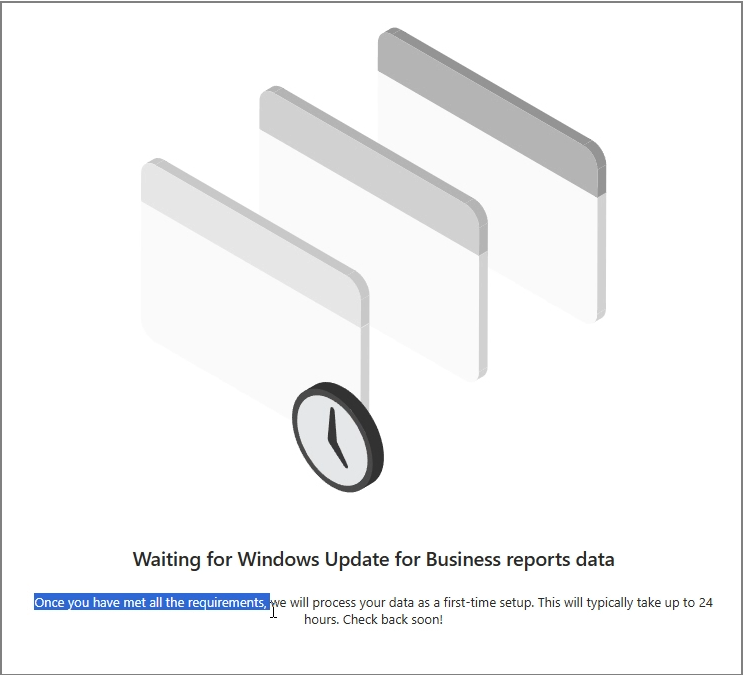
The UI mentions it may take up to 24 hours, but in my case it took 48+ hours before data appeared.
4. Confirm Data in Log Analytics
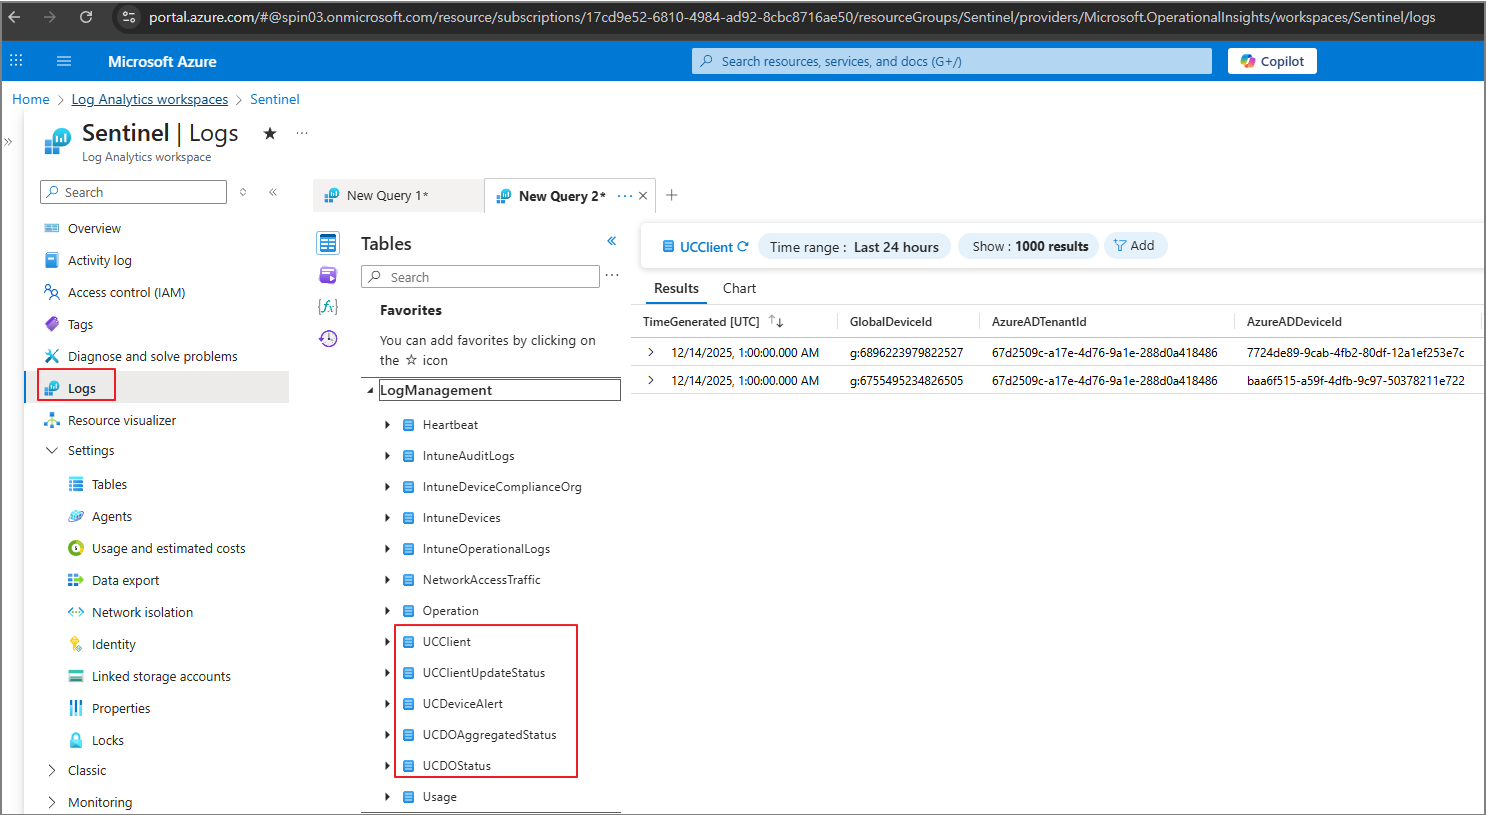
In Log Analytics, the data lands in tables that start with UC (for example, multiple UC* tables will appear once ingestion begins).
5. Understand Collection / Upload Frequency
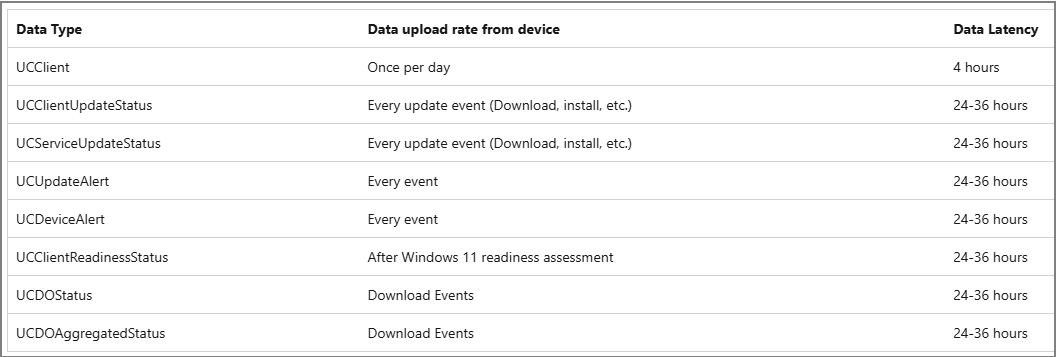
Microsoft documentation also lists data types and upload frequency/latency. Practically speaking, you should expect some tables/events to arrive on different cadences (some daily, some per update event, and with latency that can span hours to a day or more).
Step 3) Tailor the Reports with Power BI
Once data is available in Log Analytics, the easiest path to a polished dashboard is to use the official Power BI template published for Windows Update for Business reports.
1. Download the Power BI Template
From the Tech Community / Windows IT Pro blog post, download the Power BI template referenced in the guide.
When Power BI prompts for access to the Log Analytics endpoint:
Choose Organizational account
Click Connect
5. View Your Windows Update Dashboard
After authentication completes and data is loaded, the dashboard visuals populate and you can begin customizing pages, KPIs, filters, and device group views.
Wrap-Up
With just Intune, Log Analytics, and the Power BI template, you can build a practical Windows Update dashboard without writing custom scripts or maintaining a separate data pipeline. The key is getting device diagnostics configured correctly, enabling WUfB reports, and allowing enough time for ingestion to stabilize.
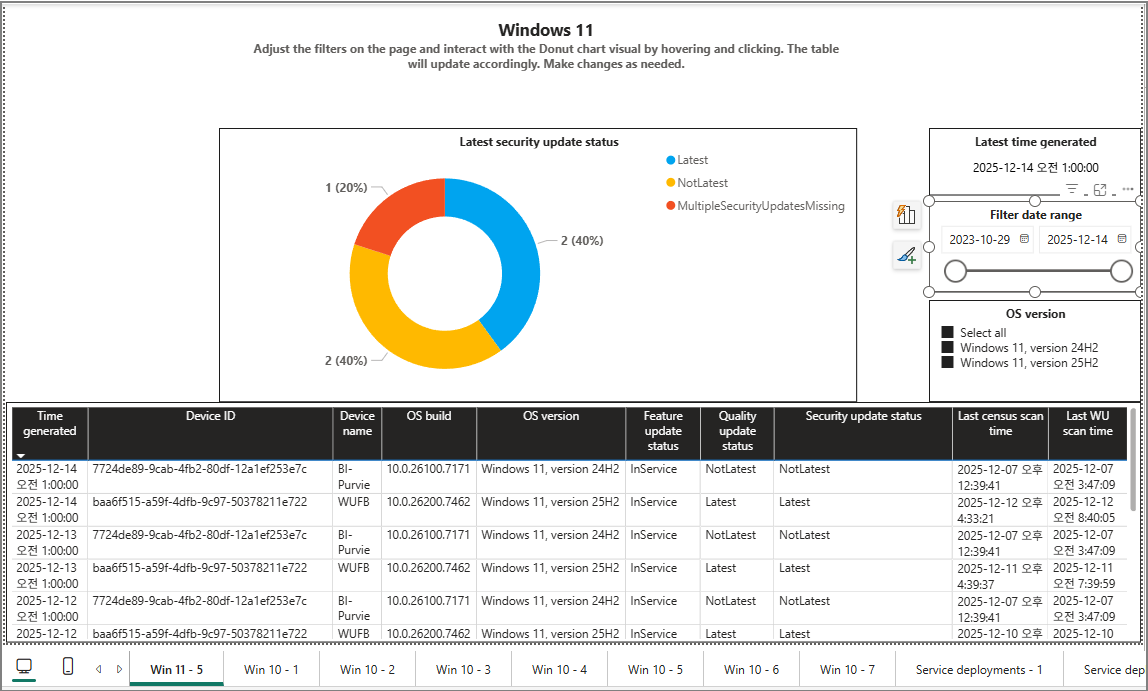
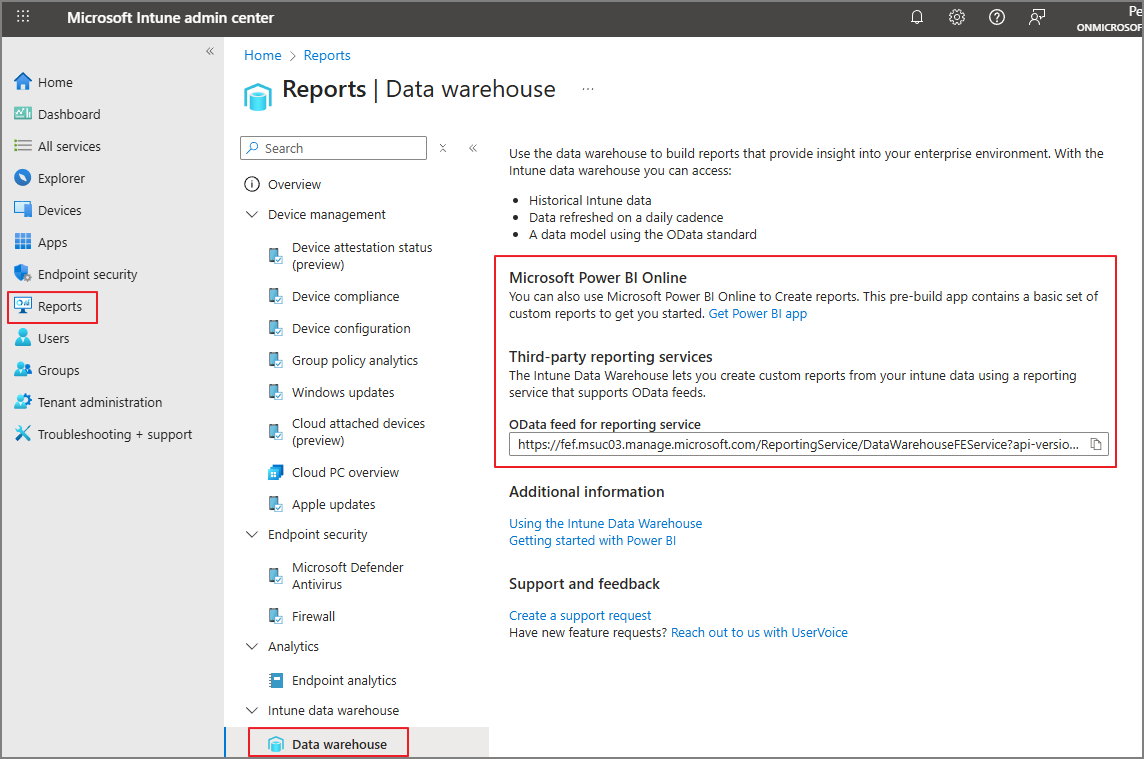
While organizing Intune policies, I discovered the existence of the Intune Data Warehouse and realized that it’s possible to build BI dashboards using Power BI.
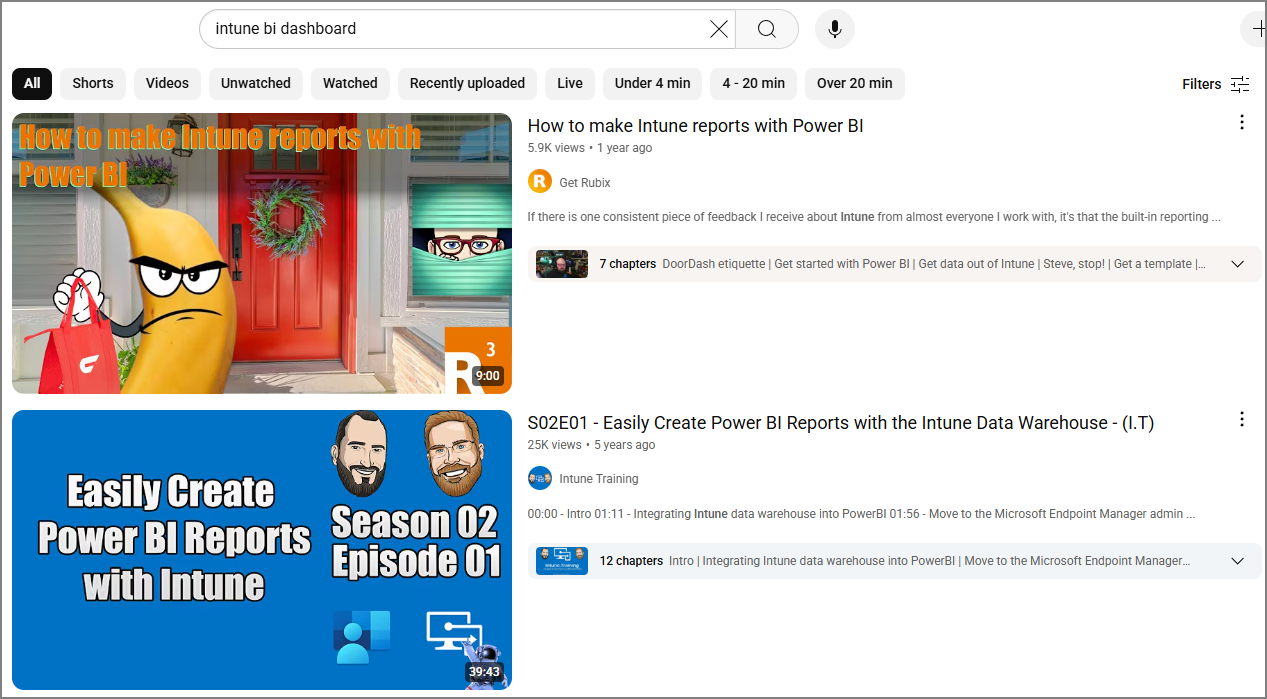
Searching on YouTube, I found that connection methods have been available for quite some time.
My goal is to visualize every area of M365, so I decided to take on the challenge right away.
There are two main ways to connect Intune Data Warehouse to Power BI.
Method 1. OData Feed
In Power BI, select Get data > OData feed
Feed URL Input
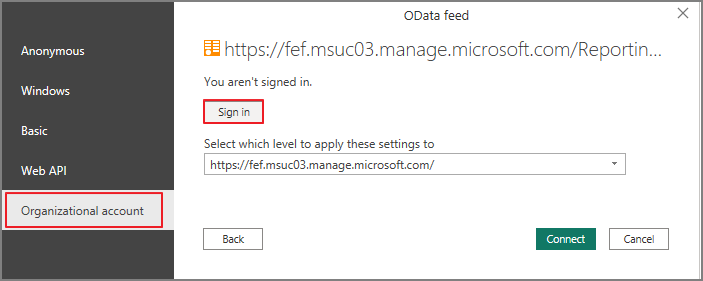
Enter your organizational account and click Connect
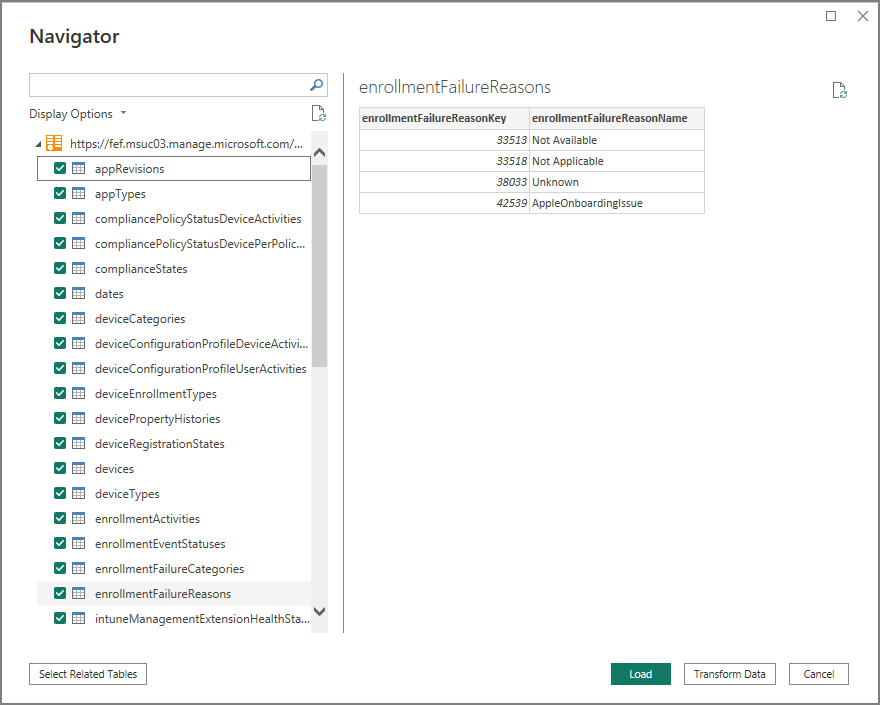
All available tables will be listed – check all and click Load
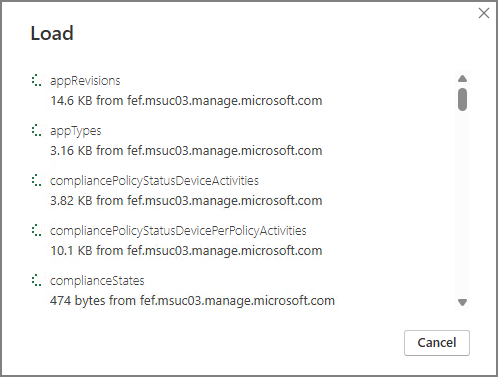
Data Loading
Import complete
Method 2. Connector
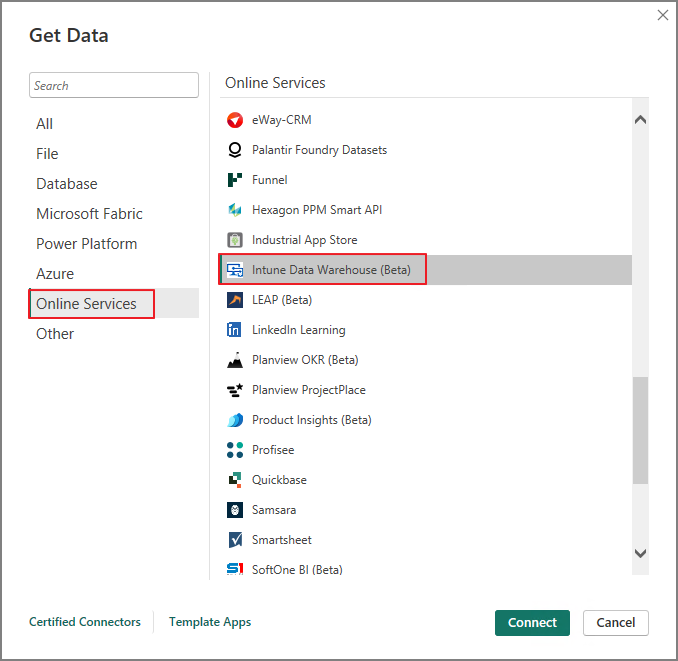
In Power BI, select Get Data > More
Online Services > Intune Data Warehouse
Specify Period
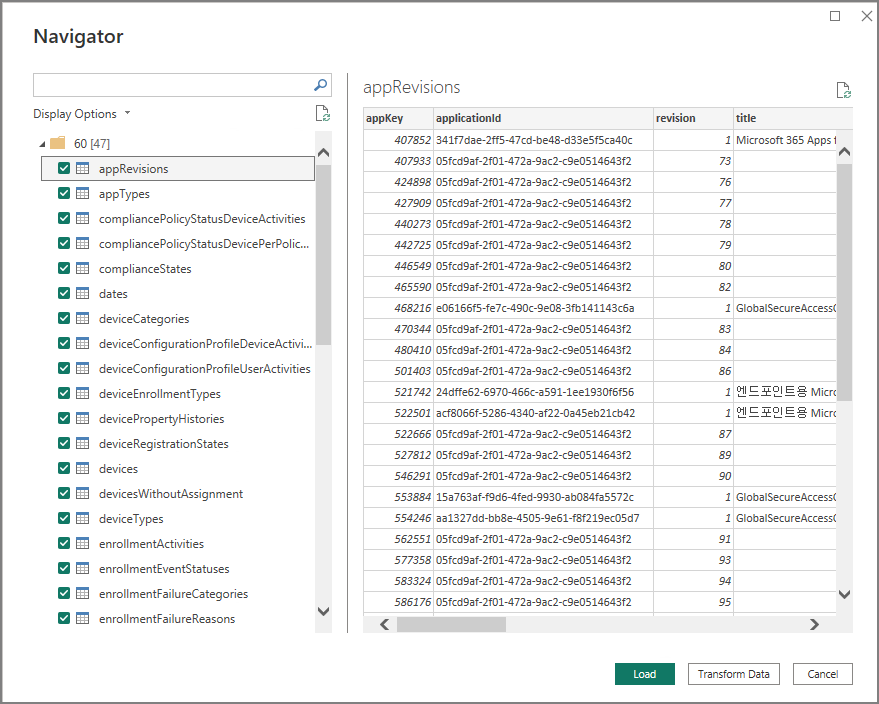
Select tables and click Load (the following steps are the same)
The Connector brings in more tables, but the meaningful data is similar OData Feed allows for custom queries via Advanced Query The Connector allows you to specify the period
This post will proceed using the Connector method.
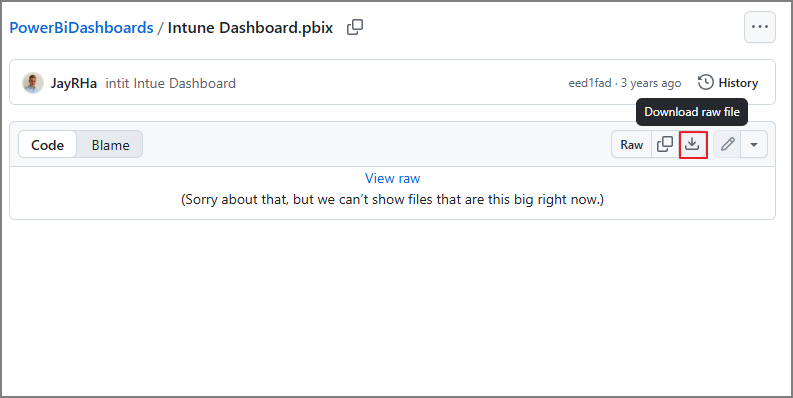
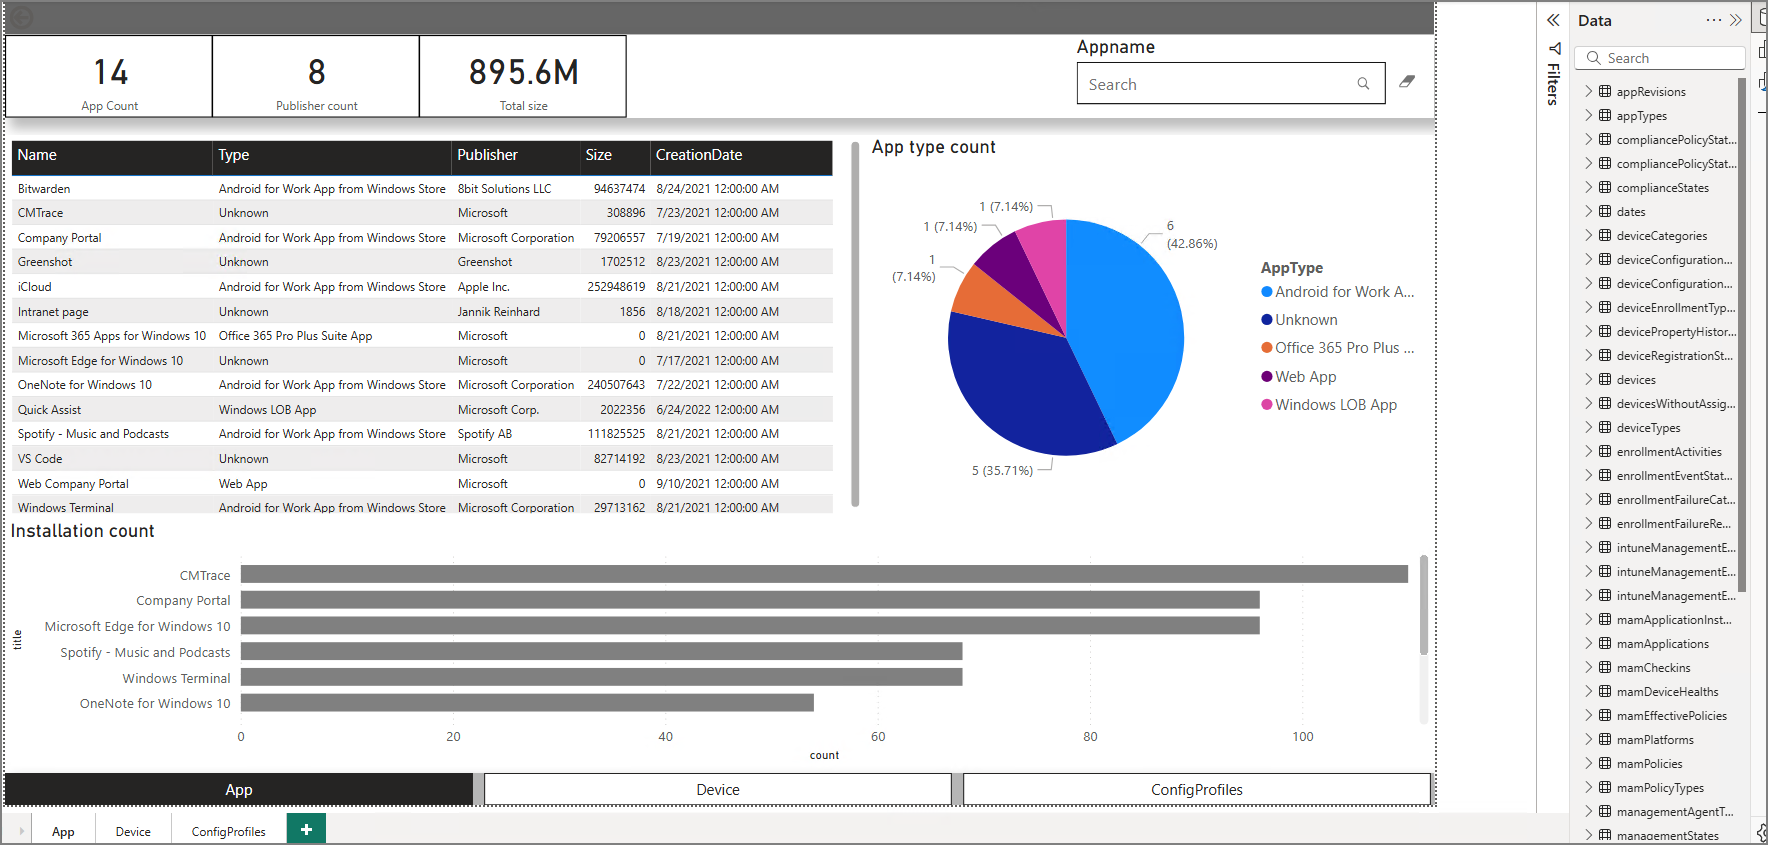
2. Download Power BI Template
Most Intune dashboard resources are based on the following template:
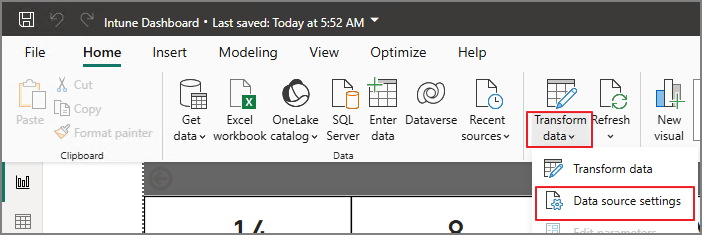
Transform data > Data source settings to check the Connector-based connection.
Refresh
you may encounter an error like below:
The template creator’s blog suggested checking the technical documentation below and changing the locale, but even after changing it, the issue was not resolved. Therefore, I proceeded by copying the template instead.
Supported languages and countries/regions for Power BI
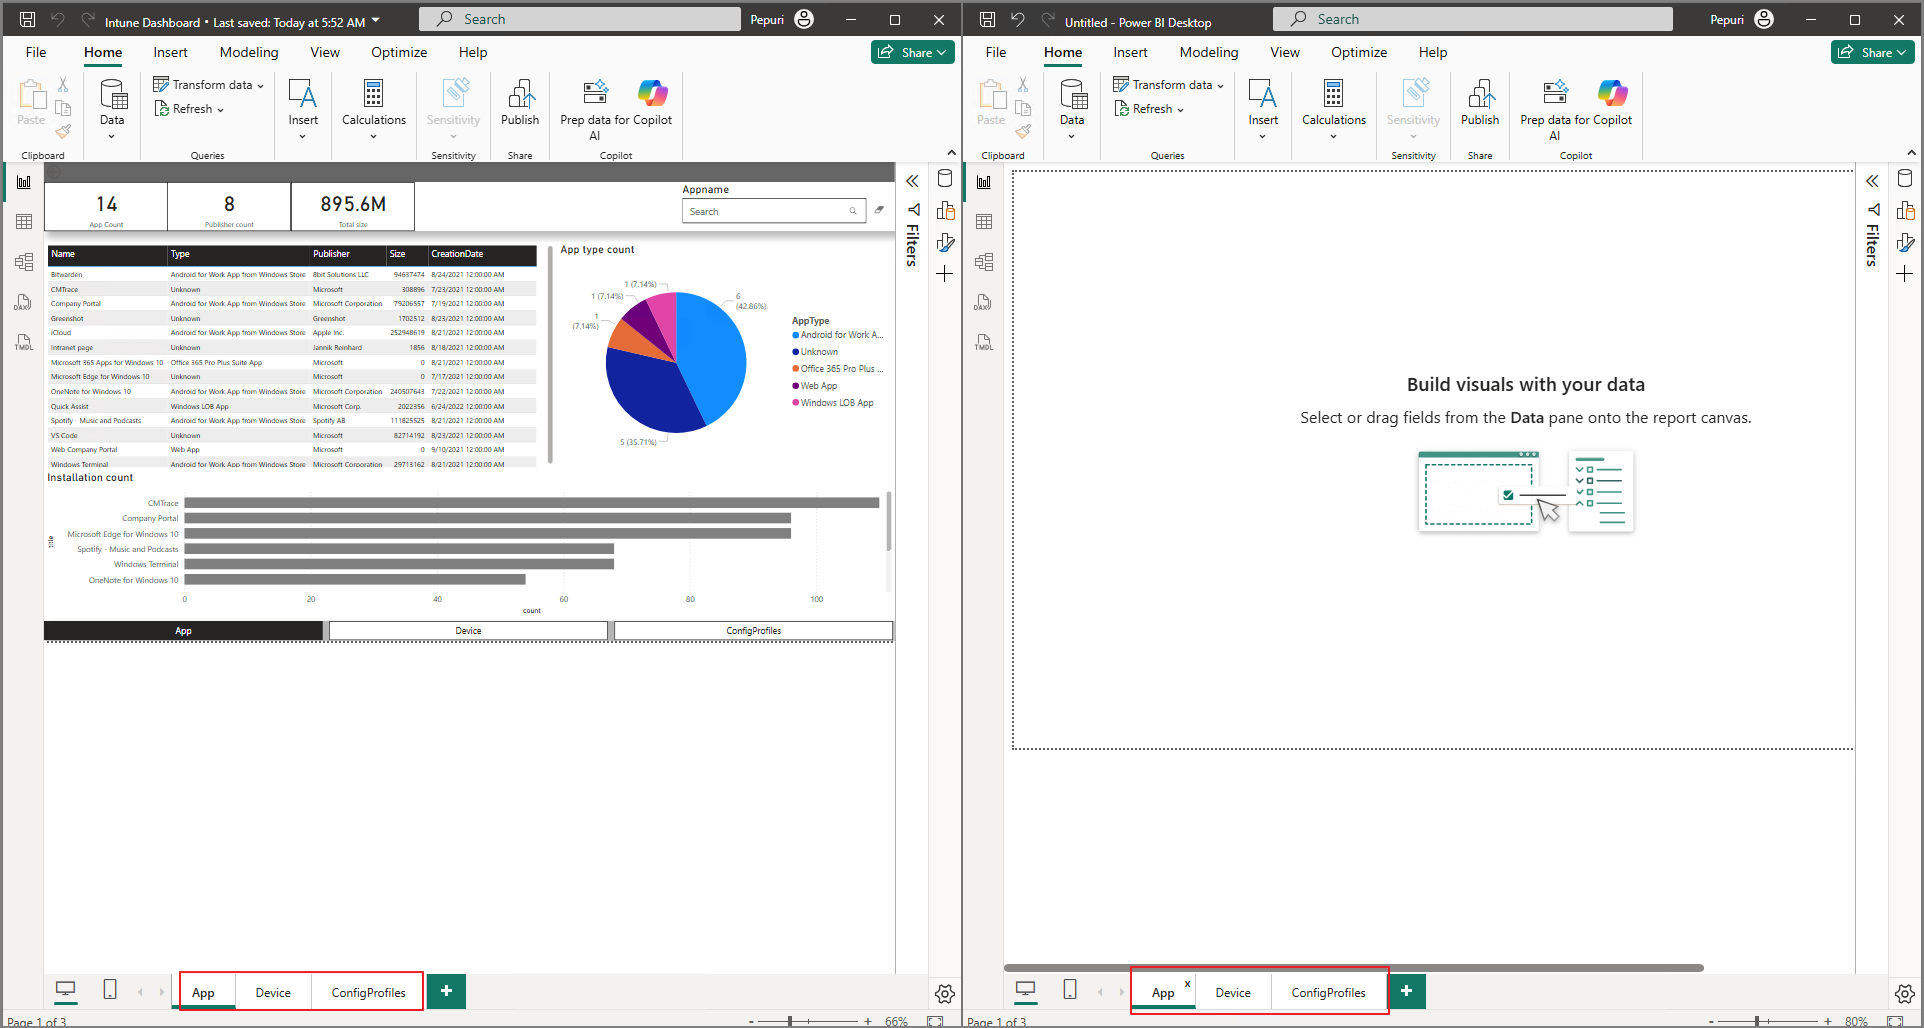
In your BI file connected to your data, add pages with the same names as the template at the bottom.
Copy and paste the three pages as shown below.
3. Add Objects and Set Relationships
Since the structure may not match, you might encounter some errors.
Adjust the structure to match.
This error occurs because the Text Filter object is missing.
Go to More visuals > From AppSource.
Search for and add the Text Filter.
After refreshing or switching pages, you’ll see the issue is resolved.
Errors on the Devices page occur because table relationships do not match the template.
Model View menu to check the differences in Relationships count.
First import data, BI automatically sets relationships.
Since each environment is different, table relationships may vary. Use the following approach as a reference, and match the relationships to the template as needed.
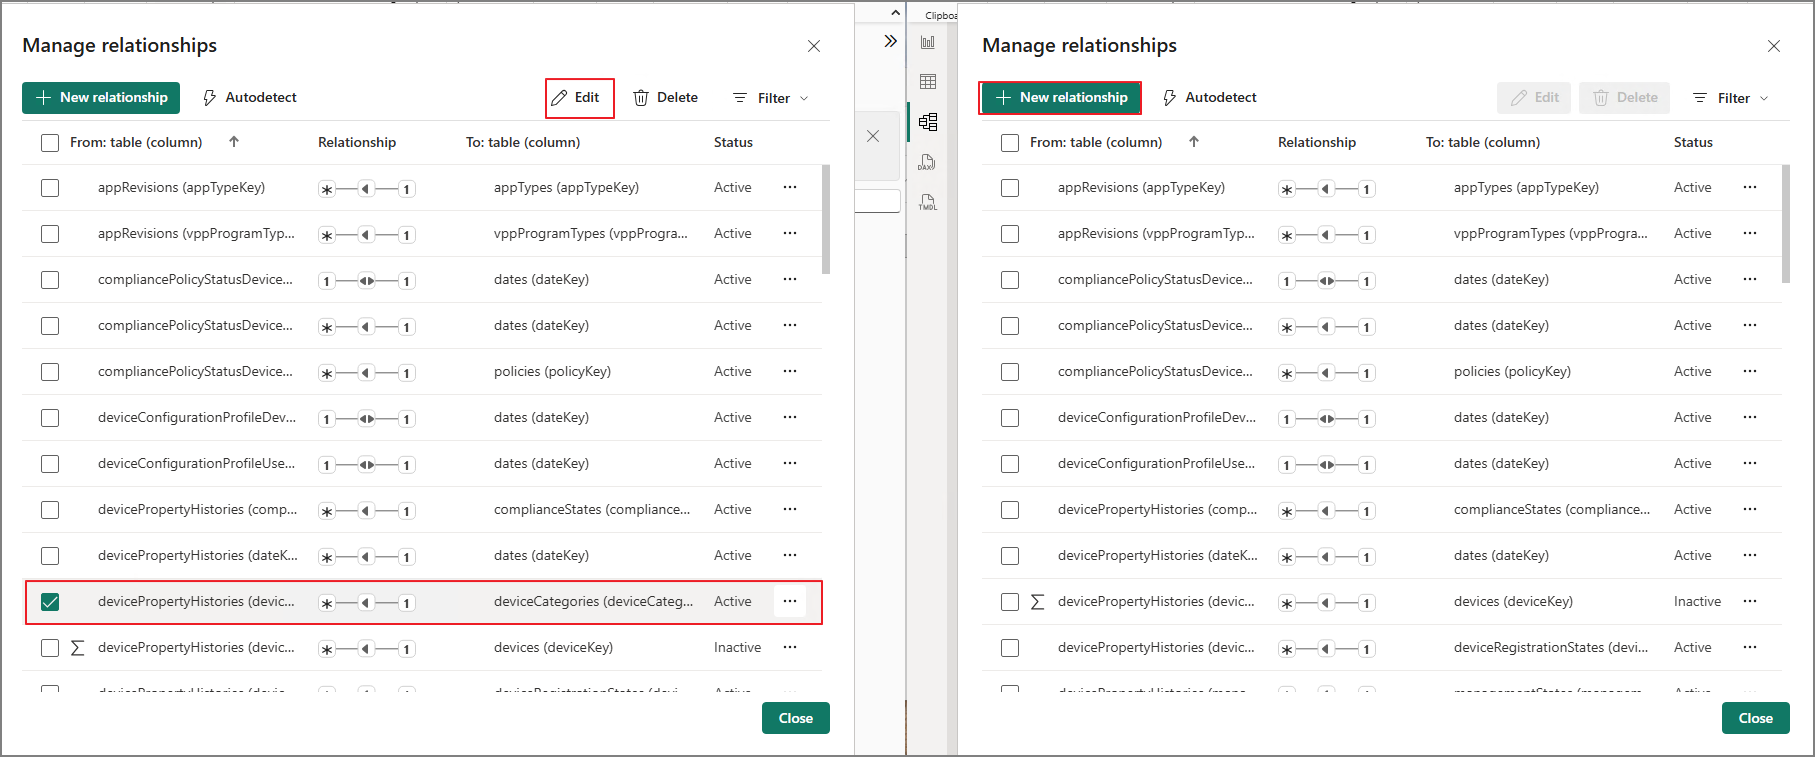
Go to Manage relationships.
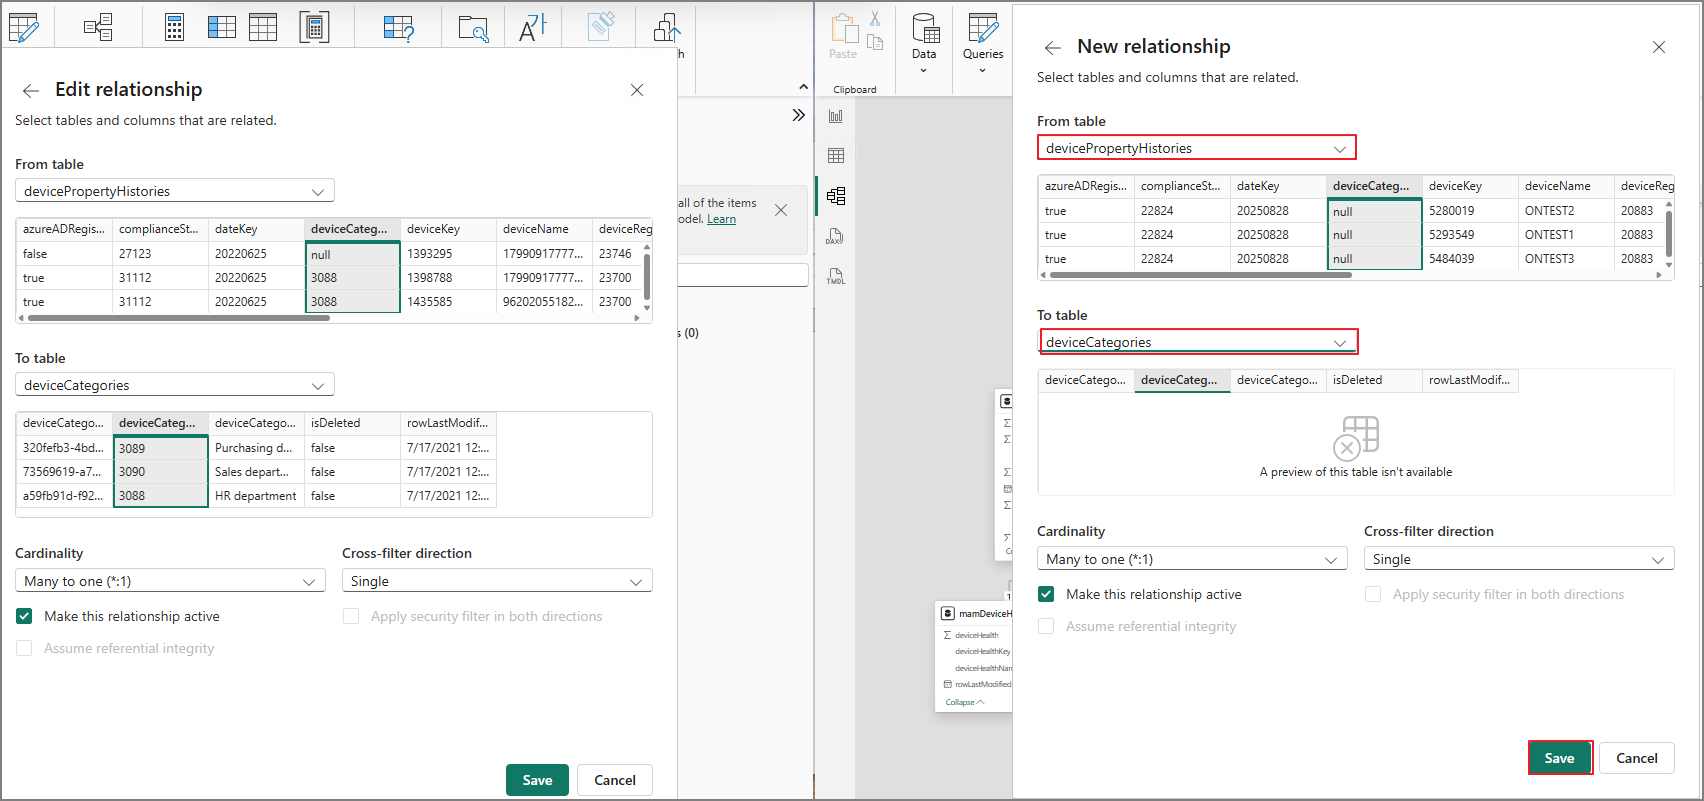
Some relationships in the template are missing in your BI.
Match Structure
After do it. Save
Sometimes, relationships are not automatically created because there’s no data on one side.
Inactive/Active reversed, fix them as well.
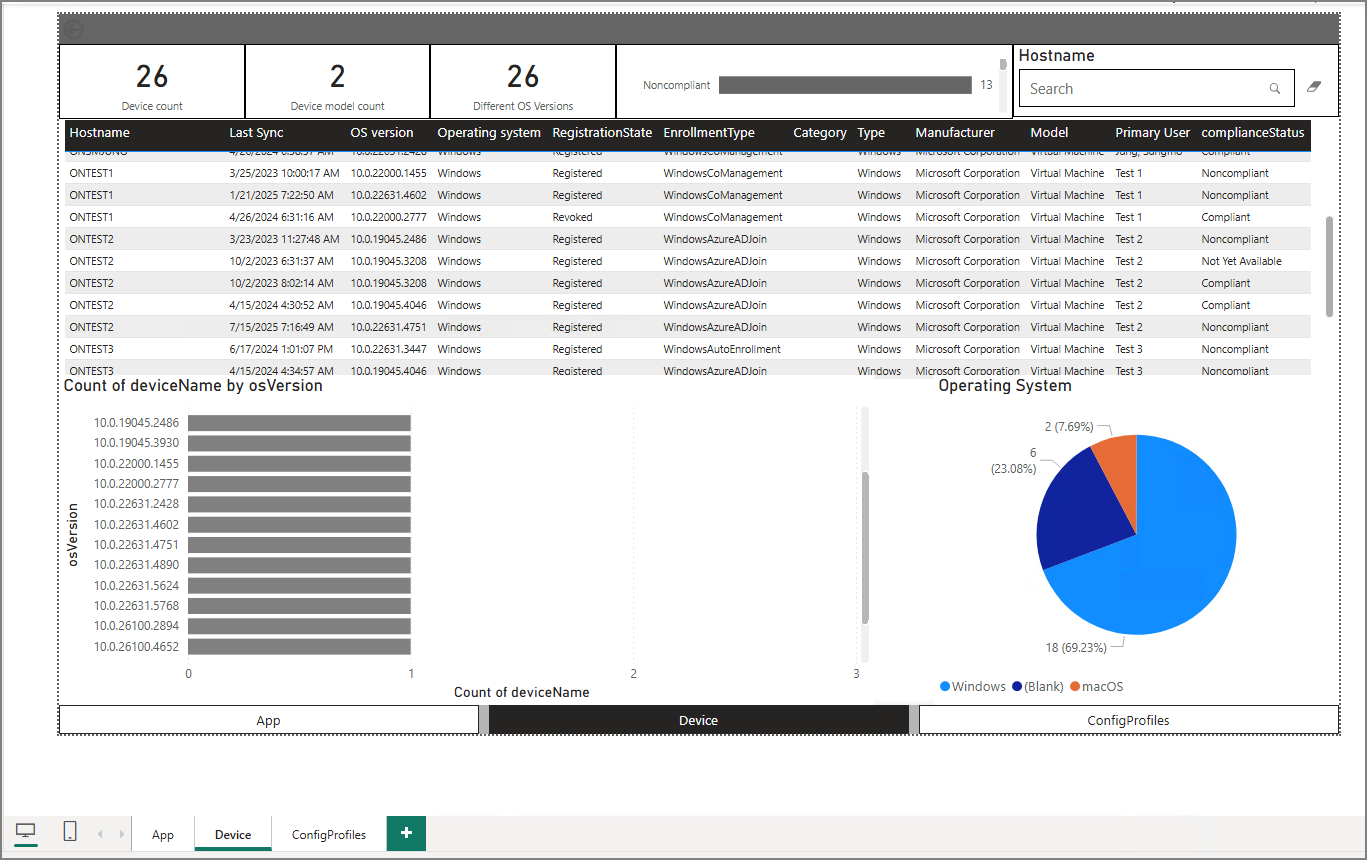
Errors on the Devices page will be resolved.
There are no errors on the ConfigProfiles page as well.
4. Conclusion
By leveraging Power BI, you can intuitively manage Intune devices.
While exporting logs using PowerShell, I started to wonder: As we move toward a more serverless cloud environment, managing logs via scheduled PowerShell scripts means I still need to operate a VM, which increases management overhead.
If you’re only considering cost, scheduling PowerShell scripts on a VM and exporting to SharePoint or OneDrive can be cheaper. However, from a long-term perspective, I believe it’s time to move away from running scheduled PowerShell scripts on VMs and adopt a serverless approach.
Also, visualizing and managing logs with BI tools can provide valuable insights. With this in mind, I anticipate that connecting to Microsoft Fabric or similar platforms will eventually become necessary.
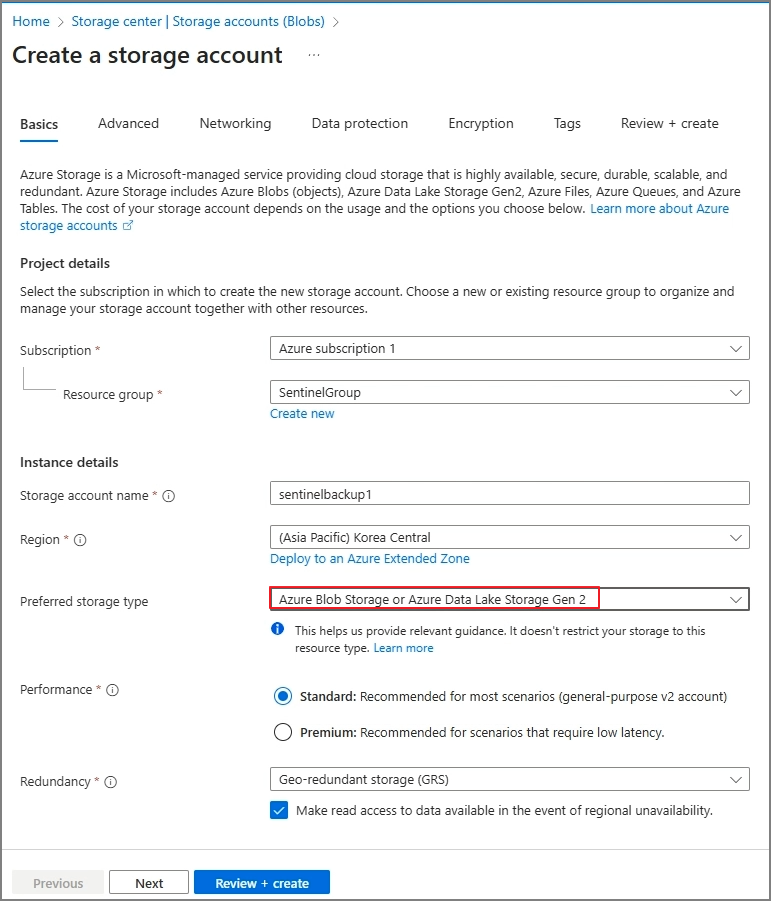
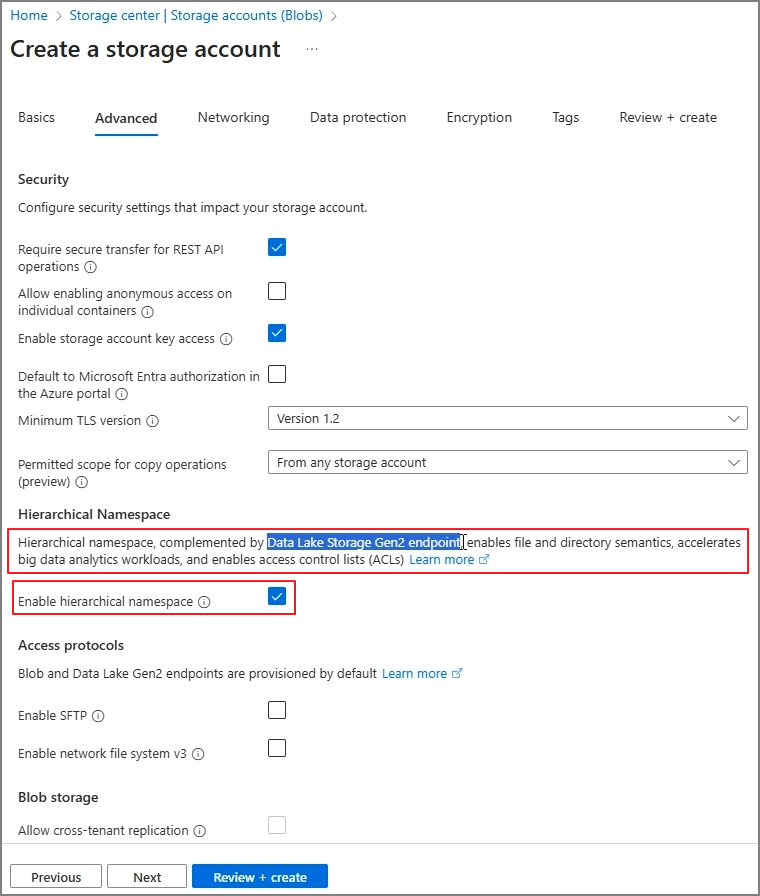
In this post, I’ll cover how to export logs to Azure Data Lake Storage (ADLS) Gen2 and connect them to BI.
Data Lake Storage Gen2 is suitable for big data analytics and other data analysis scenarios.
4. Complete the creation and verify the storage account
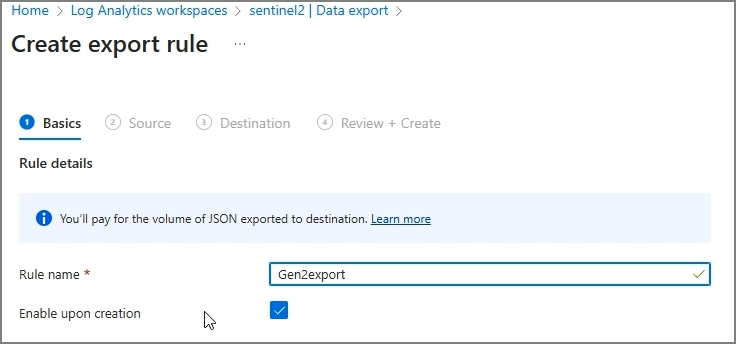
Step 2. Create an Export Rule
1. Go to Log Analytics Workspace → Settings → Data Export → Create export rule
2. Name your rule
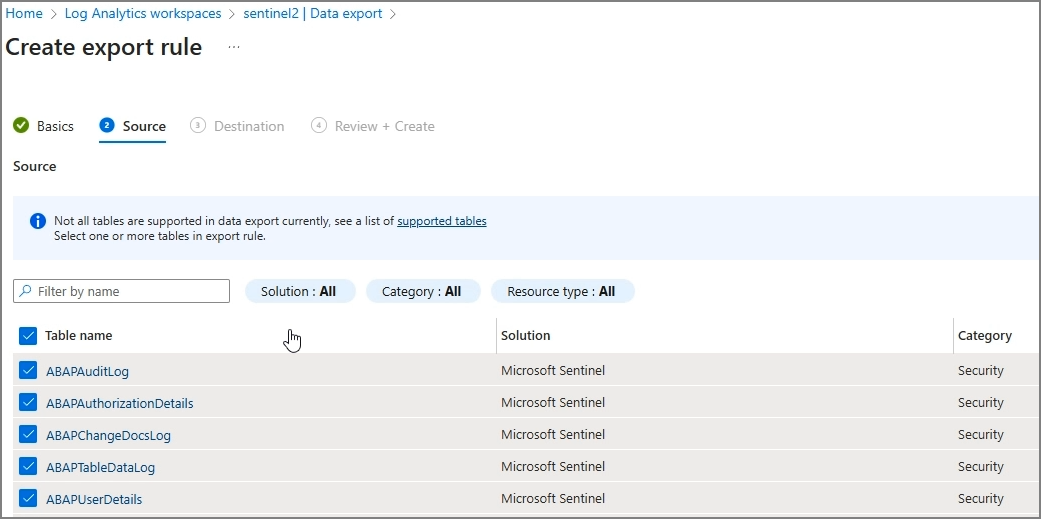
3. Select the tables to export
4. Set the destination to the storage account you created
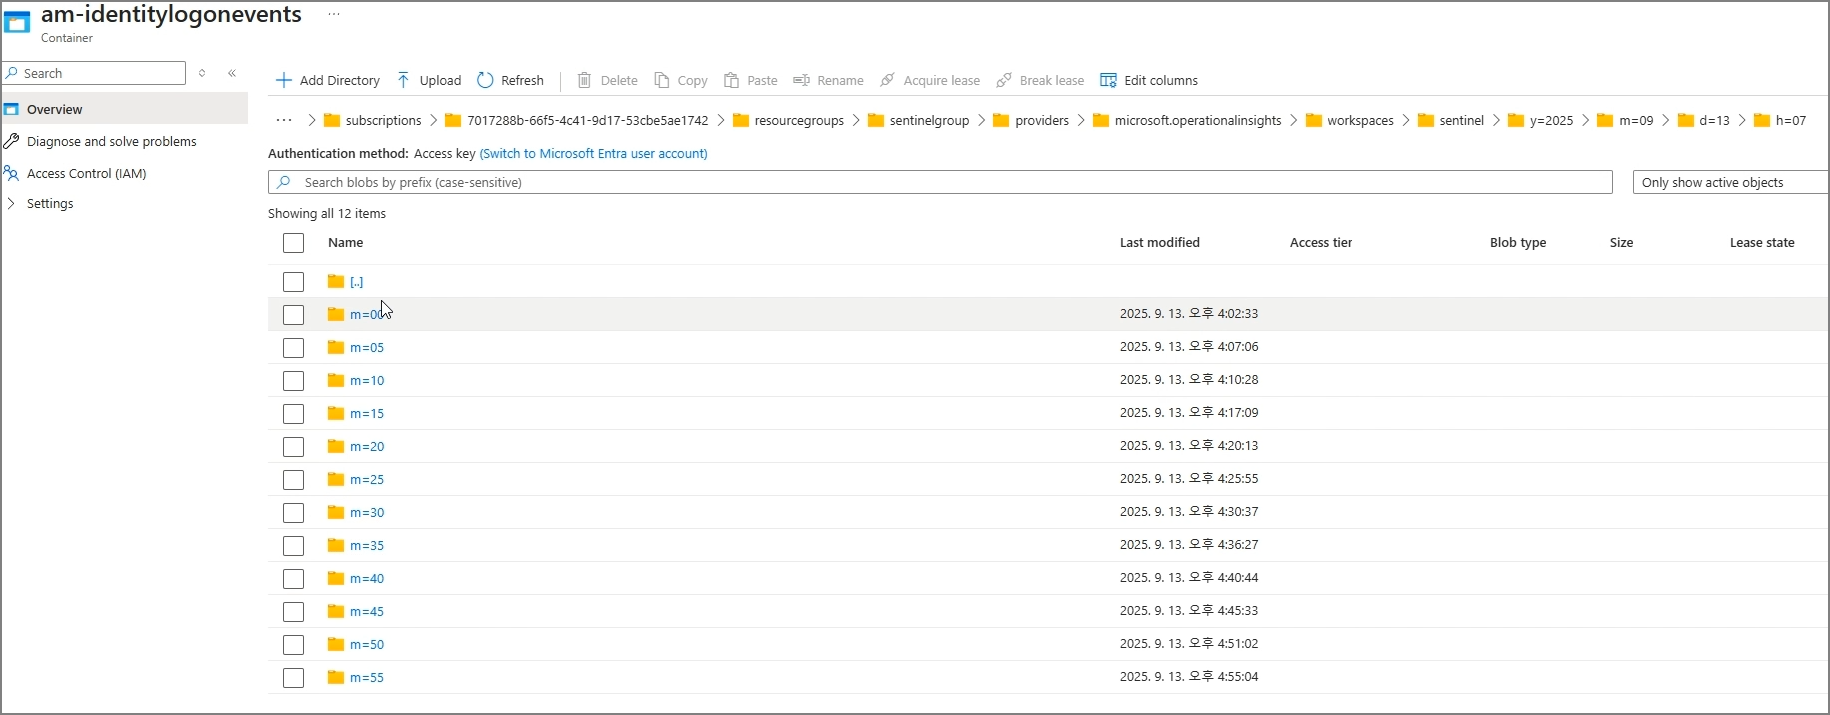
5. Go to Data storage → Containers to check the exported tables
6. Navigate through subfolders to see that exports occur every 5 minutes
Step 3. Connect to Power BI
1. In Power BI Desktop, go to Get data → More
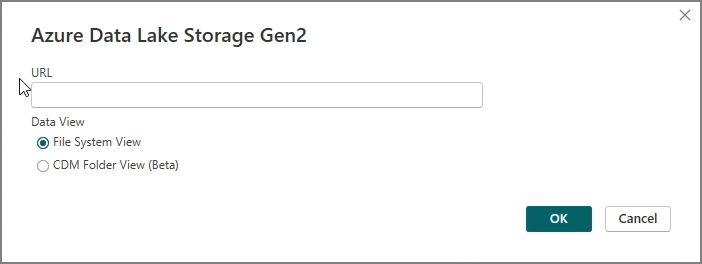
2. Select Azure → Azure Data Lake Storage Gen2
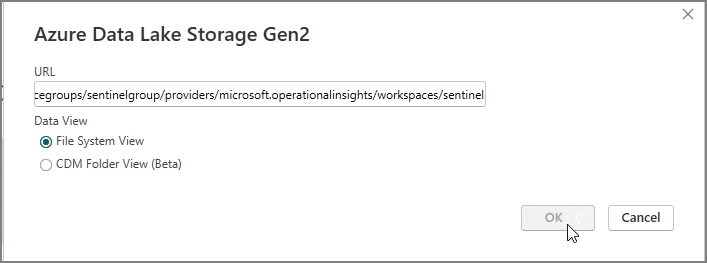
3. You’ll be prompted to enter a URL
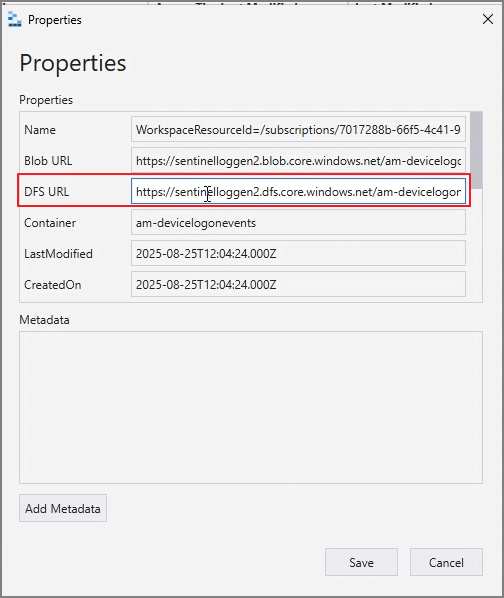
4. Find the DFS URL using Azure Storage Explorer
Go to Storage Account → Storage browser → Download and install Azure Storage Explorer
Connect, navigate to the folder path, and open Properties
Copy the DFS URL
5. Paste the URL into Power BI
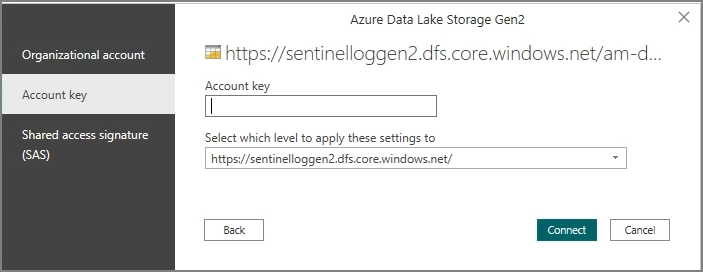
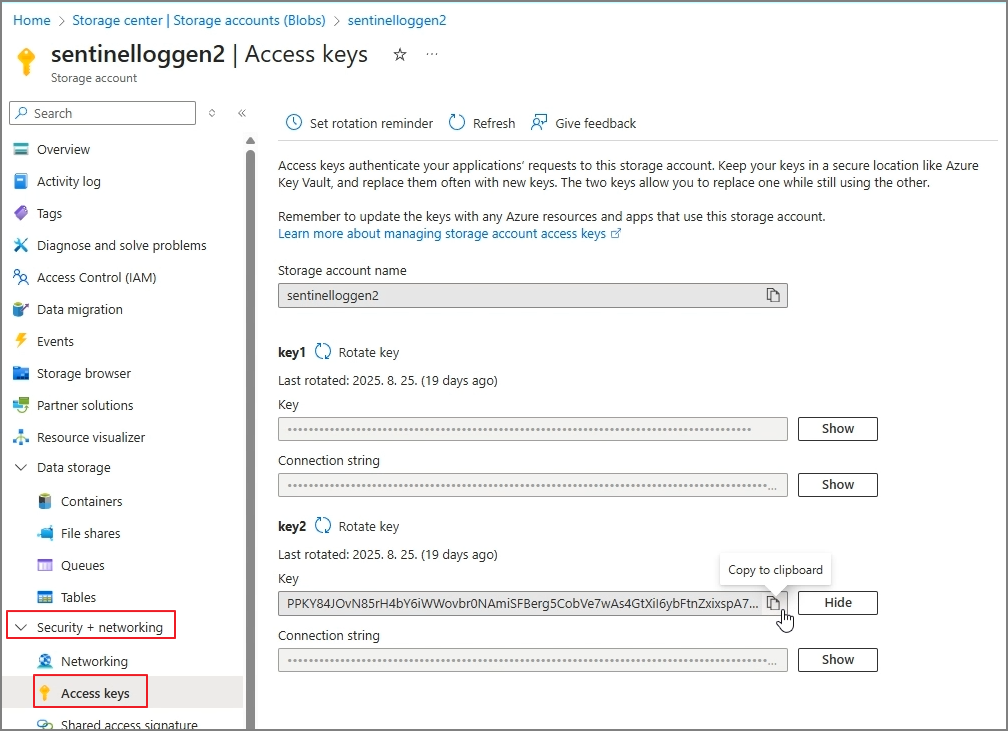
6. Enter your credentials (Account Key)
You can find the Account Key under Security + networking → Access keys
7. Connect and then Combine & Transform Data
Unlike saving to SharePoint, where you need to create queries manually, the native connector support makes this process much simpler.
Conclusion
By following these steps, you can export Microsoft 365 logs to Azure Data Lake Storage Gen2 and easily visualize them in Power BI. If you’re considering a serverless environment and BI integration, this approach offers a more efficient and scalable way to manage your logs in the long run.
In the previous post, we explored how to enable Microsoft Sentinel and start collecting Microsoft 365 logs. This time, we’ll focus on integrating Microsoft Defender for Identity (MDI) logs into Sentinel and preparing them for Power BI visualization.
Check Sensor Activation: With the latest MDI v3, activation is much simpler—if your Domain Controller is already onboarded to Microsoft
Defender for Endpoint (MDE), MDI can be enabled without additional steps.
(A separate post will cover the new version once it’s officially released.)
Verify Signals: Go to Advanced Hunting and confirm that IdentityLogonEvents are being recorded.
→ If signals appear here, you can confirm that Sentinel is also receiving MDI logs.
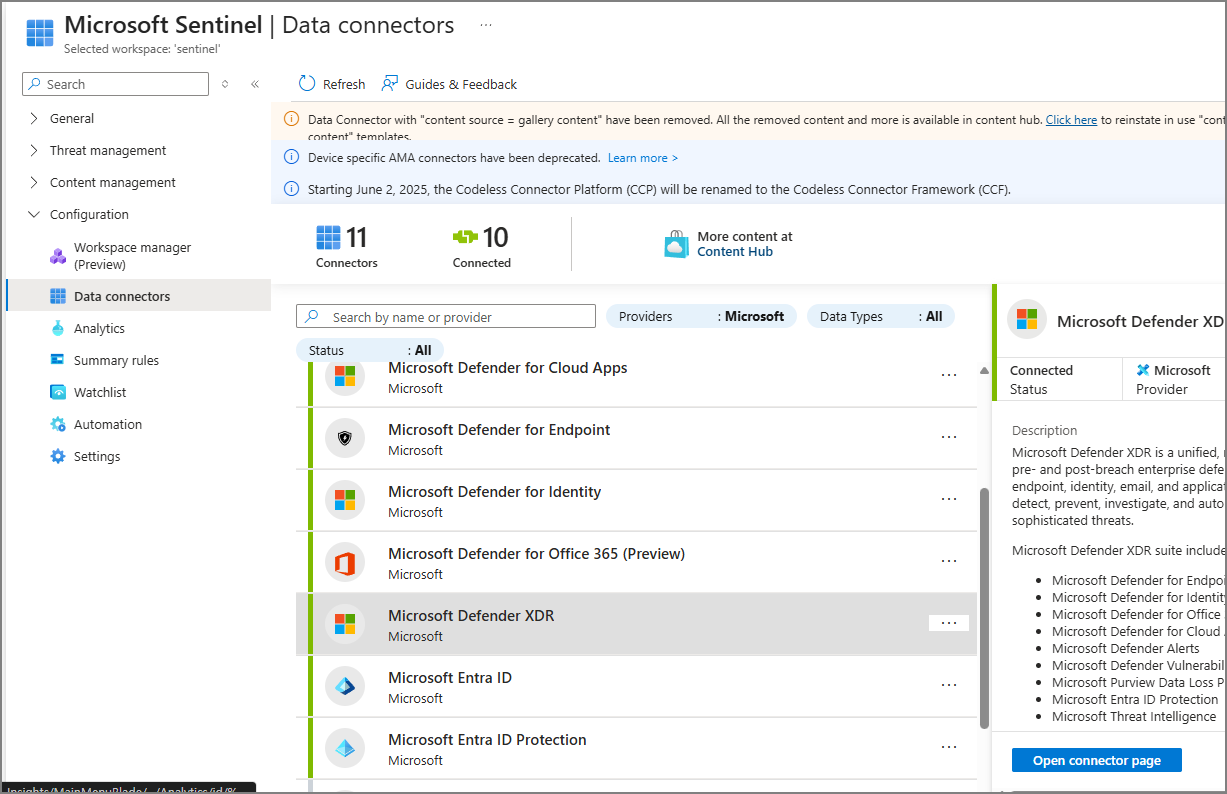
Connector Setup: Navigate to Microsoft Defender XDR → Open connector page.
→ Enable Microsoft Defender for Identity and save.
After a short delay, you should be able to query MDI logs in Sentinel.
Step 2. Register an Enterprise App for Sentinel Log Export
Currently, Advanced Hunting and Sentinel have limitations when running large queries. Our ultimate goal is to visualize data in Power BI, so we’ll first store logs as CSV files in SharePoint.
To achieve this, we’ll use the Log Analytics API, which requires Enterprise App registration.
Registration Steps
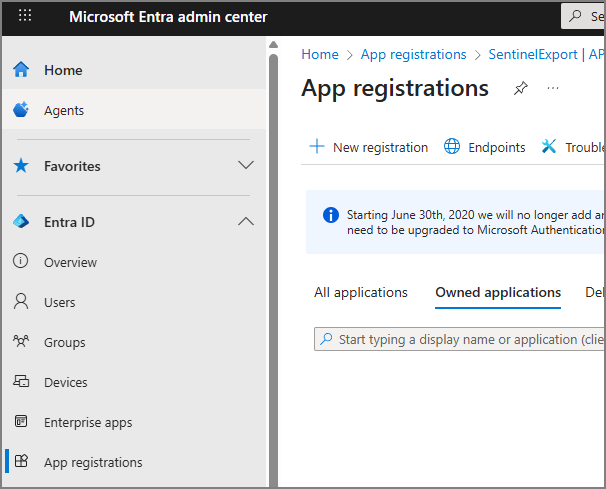
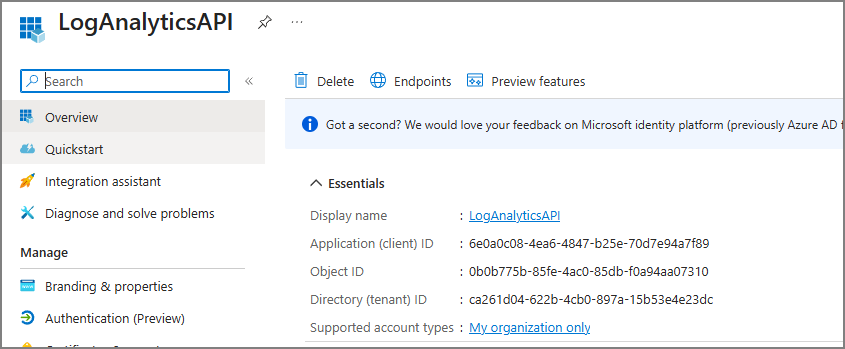
1. Go to Entra Admin Center → App registrations → New registration
2. Name the app → Register
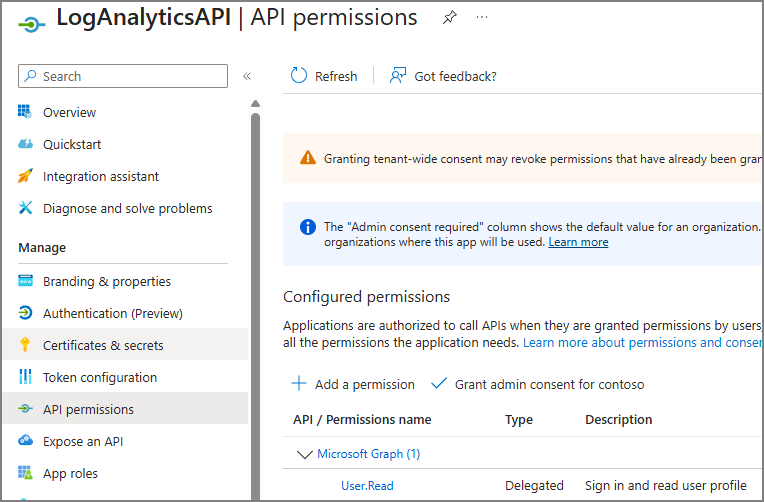
3. Navigate to API permissions → Add a permission
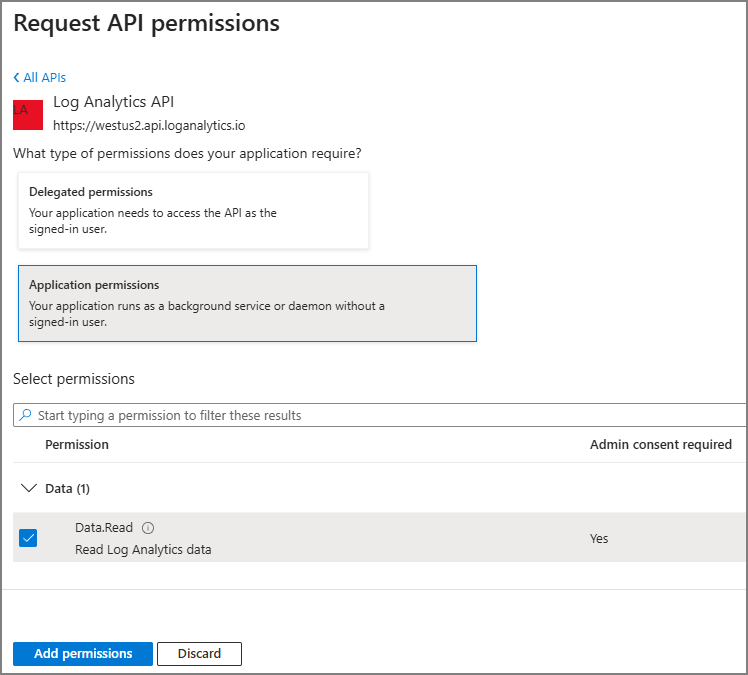
4. Select APIs my organization uses → Log Analytics API
5. Check Data.Read → Add permissions
6. Click Grant admin consent
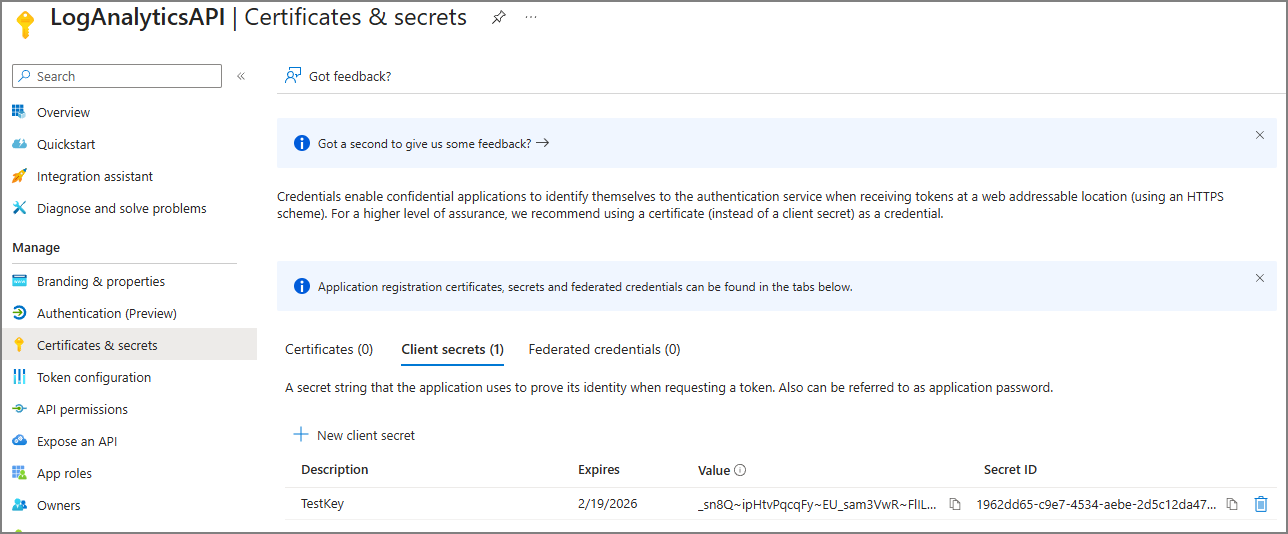
7. Go to Certificates & secrets → New client secret → Add
8. Copy the generated Value and store it securely
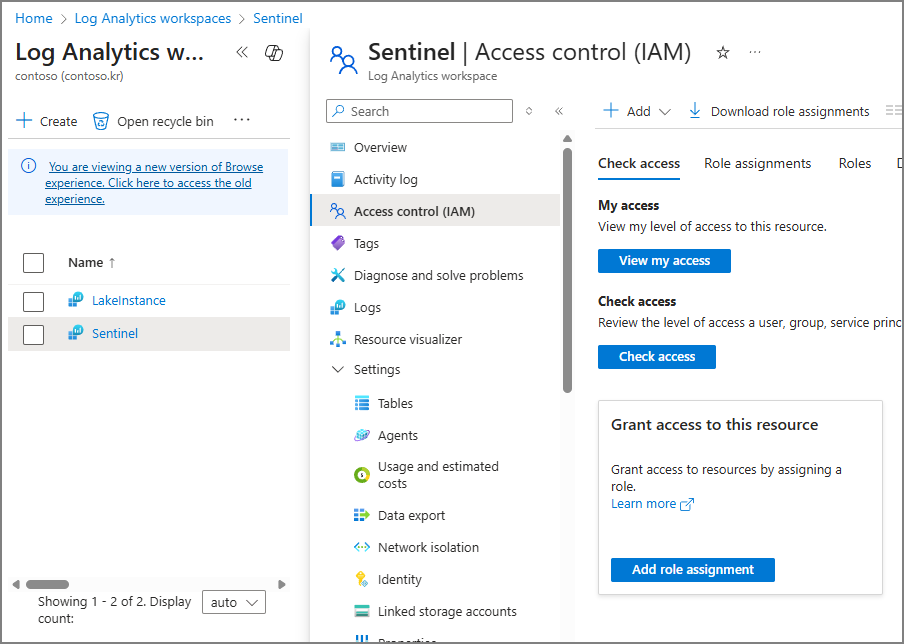
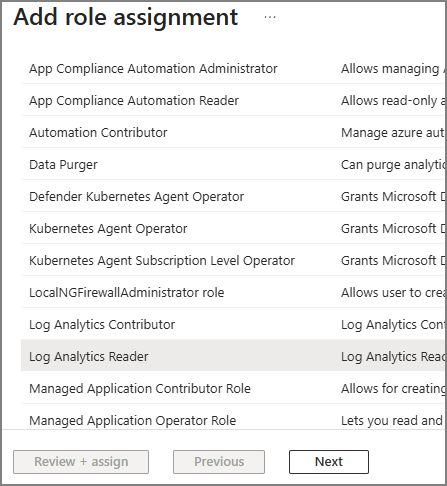
9. In Log Analytics Workspaces → Access control (IAM), click Add role assignment
10. Assign Log Analytics Reader role
11. Grant the role to the newly created app
Step 3. Export Logs to CSV
Tenant ID & Client ID
Workspace ID
Client Secret
Once these values are ready, you can use a PowerShell script to call the Log Analytics API and export logs in chunks.
I created the following script to call the Log Analytics API using AI.
Tip: Adjust ChunkHours and MinIntervalSeconds to avoid hitting API throttling limits.
When everything is configured correctly, the export process will look like this:
Step 4. Connect Power BI (Load CSV from SharePoint)
From my perspective, the ideal approach would be for Sentinel to natively support BI integration.
Although it provides queries that allow you to connect Power BI as shown below, due to API call limitations, a separate storage layer is required for effective use in BI.
The Sentinel Data Lake feature is currently available in preview, but it appears that Power BI integration is not yet supported. For now, we’ll store the data in SharePoint Online, which is a cost-effective option, and then aggregate it in Power BI.
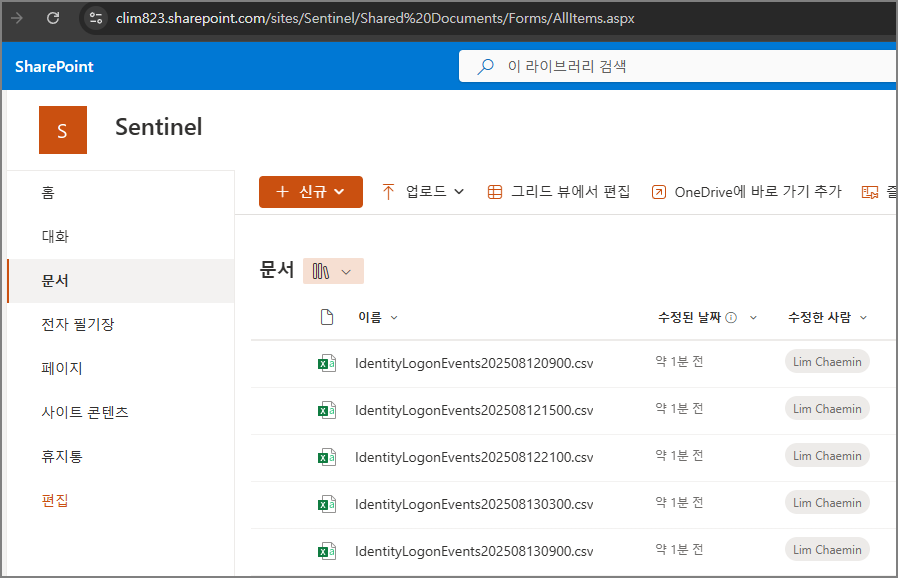
Upload CSV to SharePoint
Power BI Desktop Get Data Blank query
Advanced Editior
Paste the query below. (This was created with the help of AI.)
let
// ========== ① User Settings ==========
SiteUrl = "https://clim823.sharepoint.com/sites/Sentinel",
LibraryName = "Shared Documents",
TargetFolder = "IdentityLogonEvents",
FileNamePrefix = "IdentityLogonEvents",
KeepLastNMonths = 6,
// ========== ② File → Table Conversion Function ==========
ParseCsv = (fileContent as binary) as table =>
let
csv = Csv.Document(
fileContent,
[Delimiter = ",", Columns = null, Encoding = 65001, QuoteStyle = QuoteStyle.Csv]
),
promoted = Table.PromoteHeaders(csv, [PromoteAllScalars = true])
in
promoted,
// ========== ③ Navigate to Target Folder ==========
Source = SharePoint.Contents(SiteUrl, [ApiVersion = 15]),
Library = Source{[Name=LibraryName]}[Content],
Folder = Library{[Name=TargetFolder]}[Content], // DeviceLogonEvents
// ========== ④ Filter Files ==========
FilteredByName = Table.SelectRows(Folder, each Text.StartsWith([Name], FileNamePrefix)),
FilteredByExt = Table.SelectRows(FilteredByName, each Text.Lower([Extension]) = ".csv"),
// ========== ⑤ Load Files → Convert to Tables ==========
AddedData = Table.AddColumn(FilteredByExt, "Data", each ParseCsv([Content]), type table),
TablesList = List.RemoveNulls(List.Transform(AddedData[Data], each try _ otherwise null)),
// ========== ⑥ Align Schema & Merge ==========
AllCols = if List.Count(TablesList) = 0
then {}
else List.Distinct(List.Combine(List.Transform(TablesList, each Table.ColumnNames(_)))),
AlignedTables = List.Transform(TablesList, each Table.ReorderColumns(_, AllCols, MissingField.UseNull)),
Appended = if List.Count(AlignedTables) = 0
then #table(AllCols, {})
else Table.Combine(AlignedTables),
// ========== ⑦ Filter by Last N Months ==========
WithTimestampTyped = if List.Contains(Table.ColumnNames(Appended), "Timestamp")
then Table.TransformColumnTypes(Appended, {{"Timestamp", type datetime}})
else Appended,
FilteredByDate =
if List.Contains(Table.ColumnNames(WithTimestampTyped), "Timestamp")
then Table.SelectRows(WithTimestampTyped, each [Timestamp] >= Date.AddMonths(DateTime.LocalNow(), -KeepLastNMonths))
else WithTimestampTyped
in
FilteredByDate
Close & Apply
Using this data, you can build dashboards that provide valuable insights into identity-related activities, as shown below.
Why This Matters
By connecting MDI logs to Sentinel and then visualizing them in Power BI, you can:
Detect suspicious identity activities faster
Correlate identity signals with other security data
Build interactive dashboards for security insights
One of the biggest challenges I faced while managing Microsoft 365 was log management. Initially, message trace and audit logs were enough. But as I started incorporating security solutions like Microsoft Defender, the amount of data skyrocketed.
How We Used to Do It
Previously, I relied on PowerShell scripts to extract logs, store them in a separate repository, and later manage them via SQL Server for analysis. While this worked, it had several drawbacks:
Required a dedicated VM for log collection
Credential management was cumbersome and posed security risks
Didn’t align well with the SaaS-first approach
Frequent schema changes and new log types increased maintenance overhead
In short, the process became increasingly labor-intensive.
Why I Chose Microsoft Sentinel
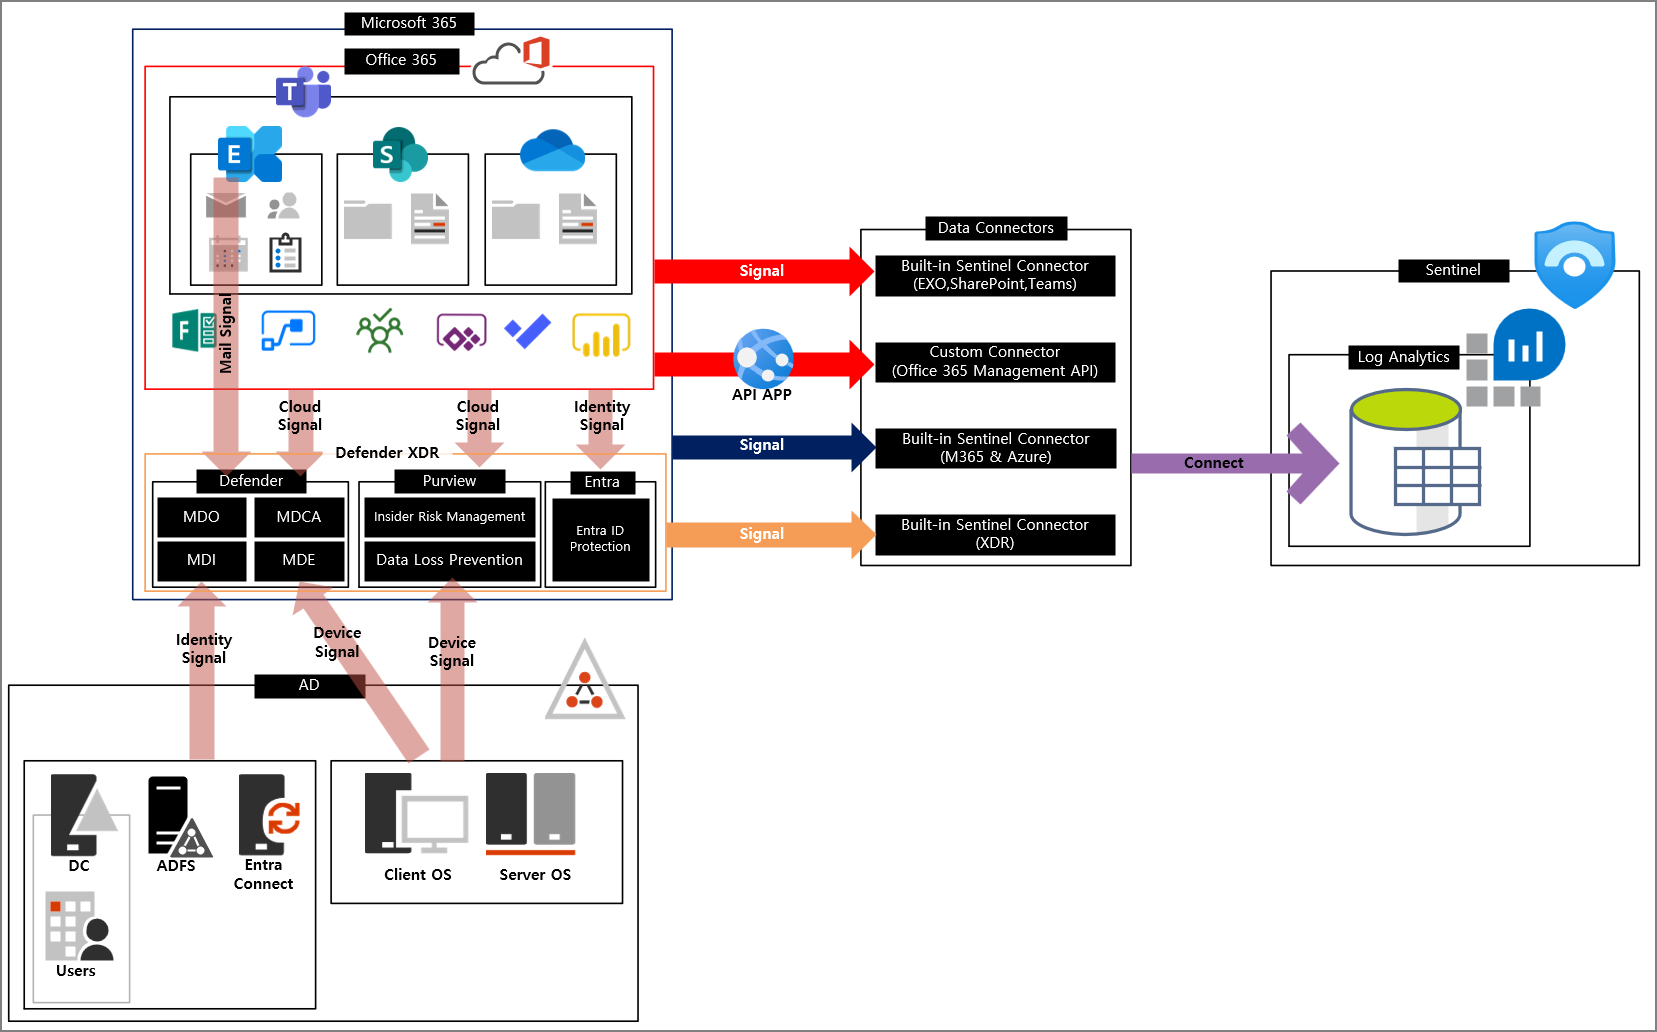
To solve these issues, I turned to Microsoft Sentinel. Although Sentinel is primarily a SIEM solution, my initial goal is centralized log management. Here’s why Sentinel stood out:
Native integration with Microsoft 365
Automated log collection and schema updates
Easy integration with Defender, Entra, Intune, and more
The Role of AI
Thanks to AI, the barrier to entry for these technologies has dropped significantly. With Copilot, I can leverage the data stored in Sentinel more intelligently. Once logs are ingested into Sentinel, it’s like having a database ready for advanced analytics—and AI can answer questions based on that data.
This marks the beginning of a shift from manual log management to a more automated and intelligent approach.
What is Microsoft Sentinel?
Microsoft Sentinel is a cloud-native SIEM (Security Information and Event Management) solution that collects and analyzes security logs and events from multiple sources. It supports threat detection, automated response, and security operations efficiency.
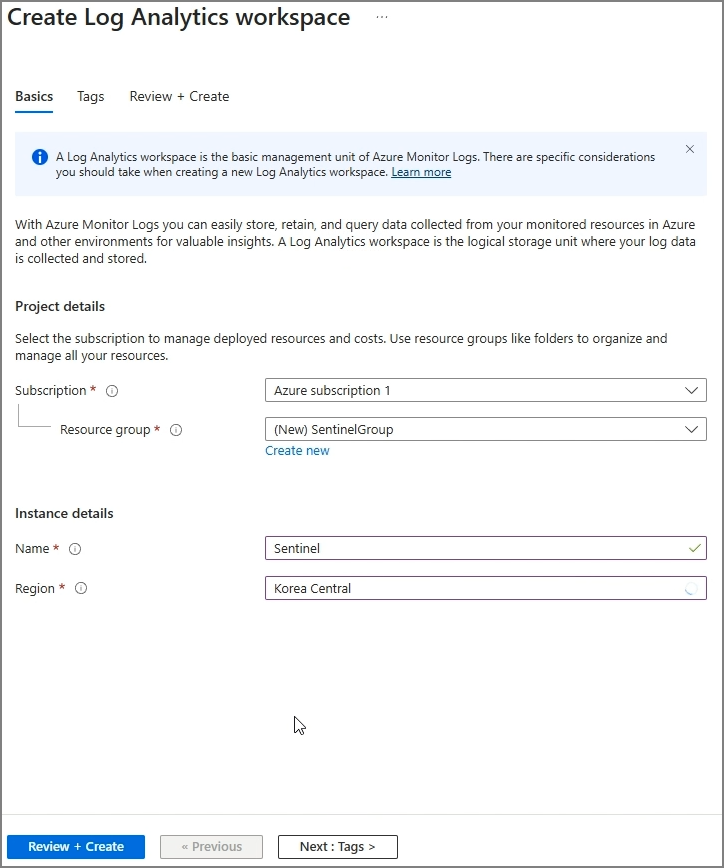
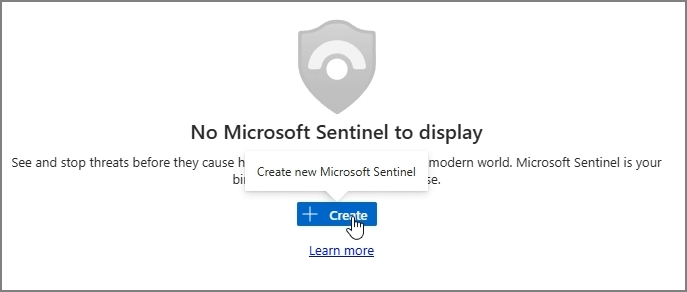
3. Add Microsoft 365 Data Connectors - Go to Content Hub
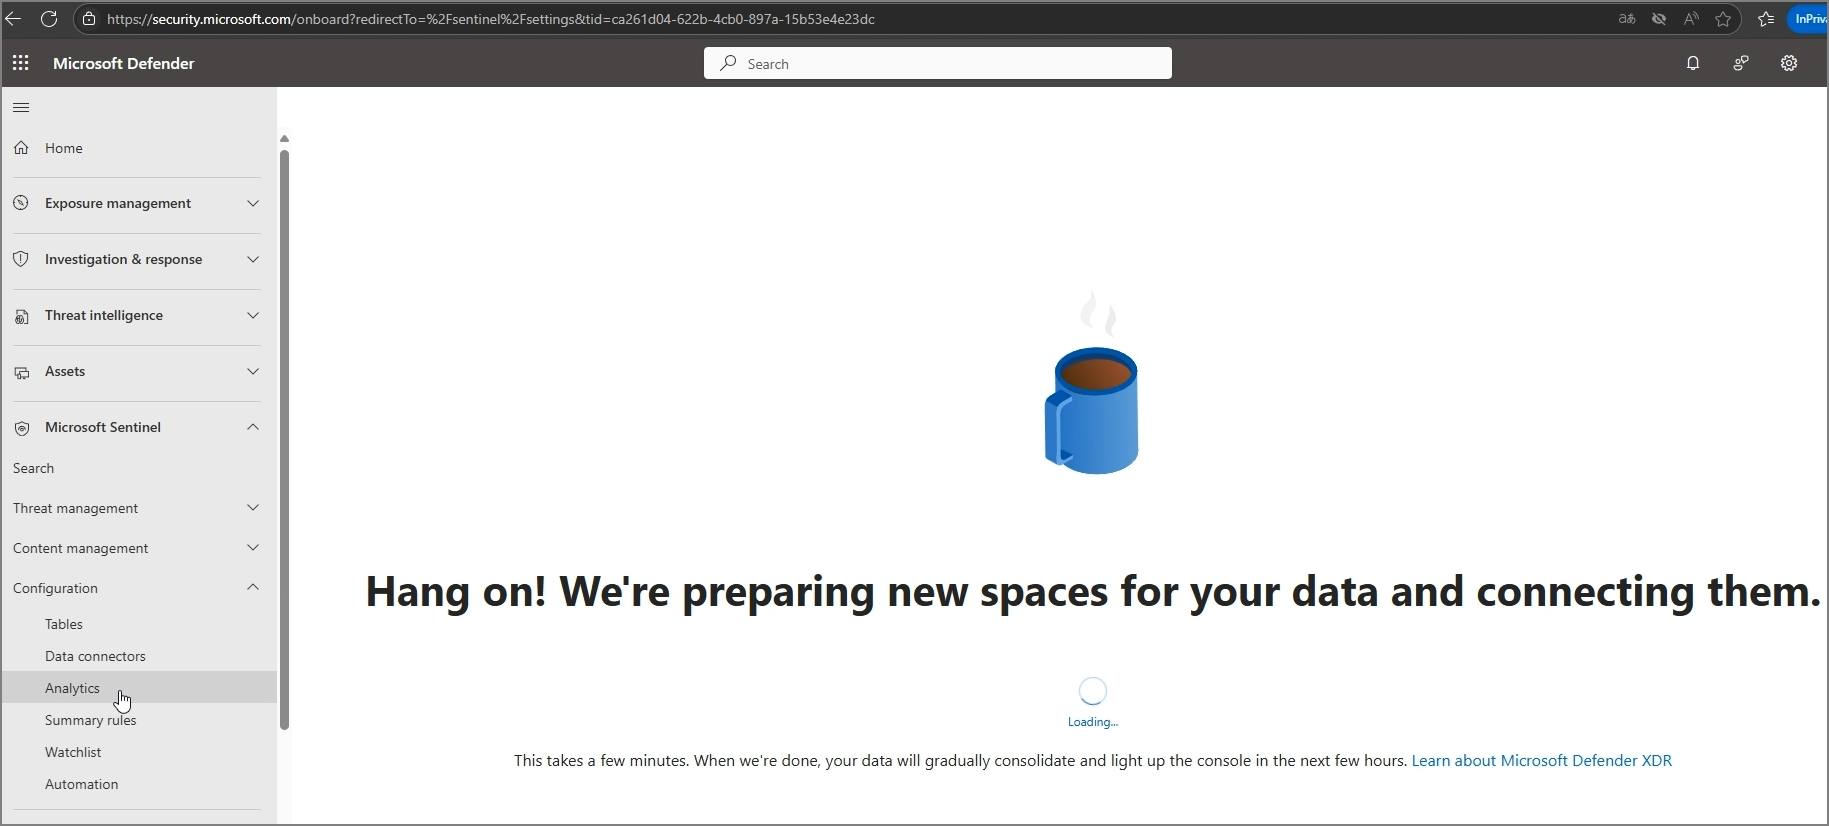
Currently, Sentinel is being integrated with the Defender page. If you go to Defender (Security.microsoft.com) and click on Microsoft Sentinel, you can confirm that it is being provisioned.
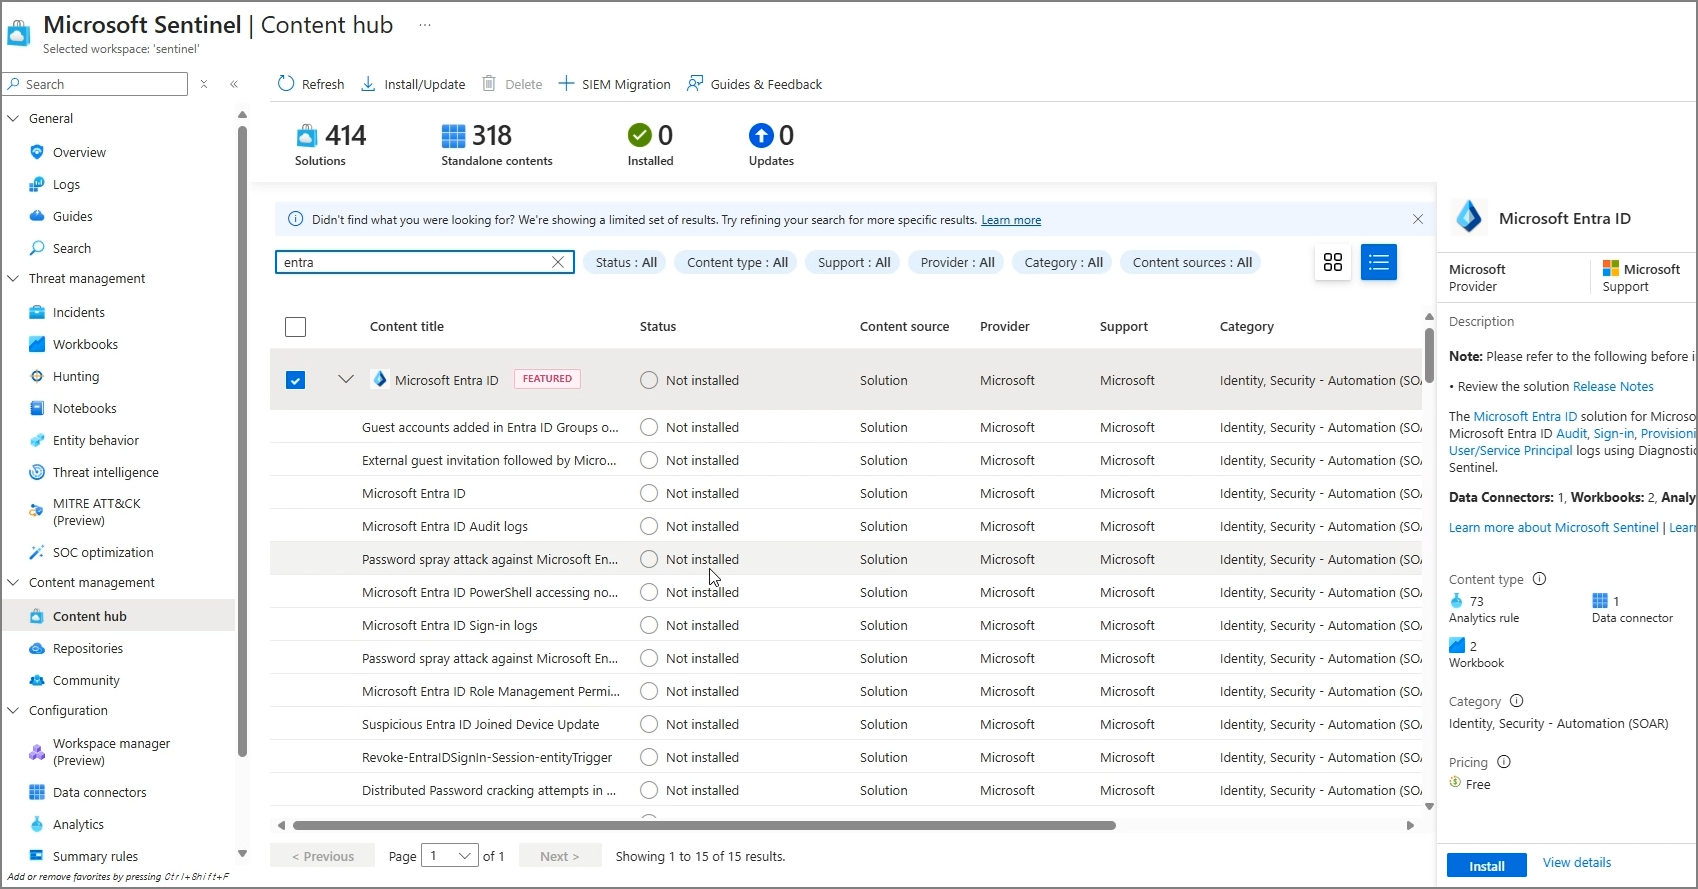
If you refresh in the Content hub within Sentinel on Azure, you will see the available Content that can be added as shown below.
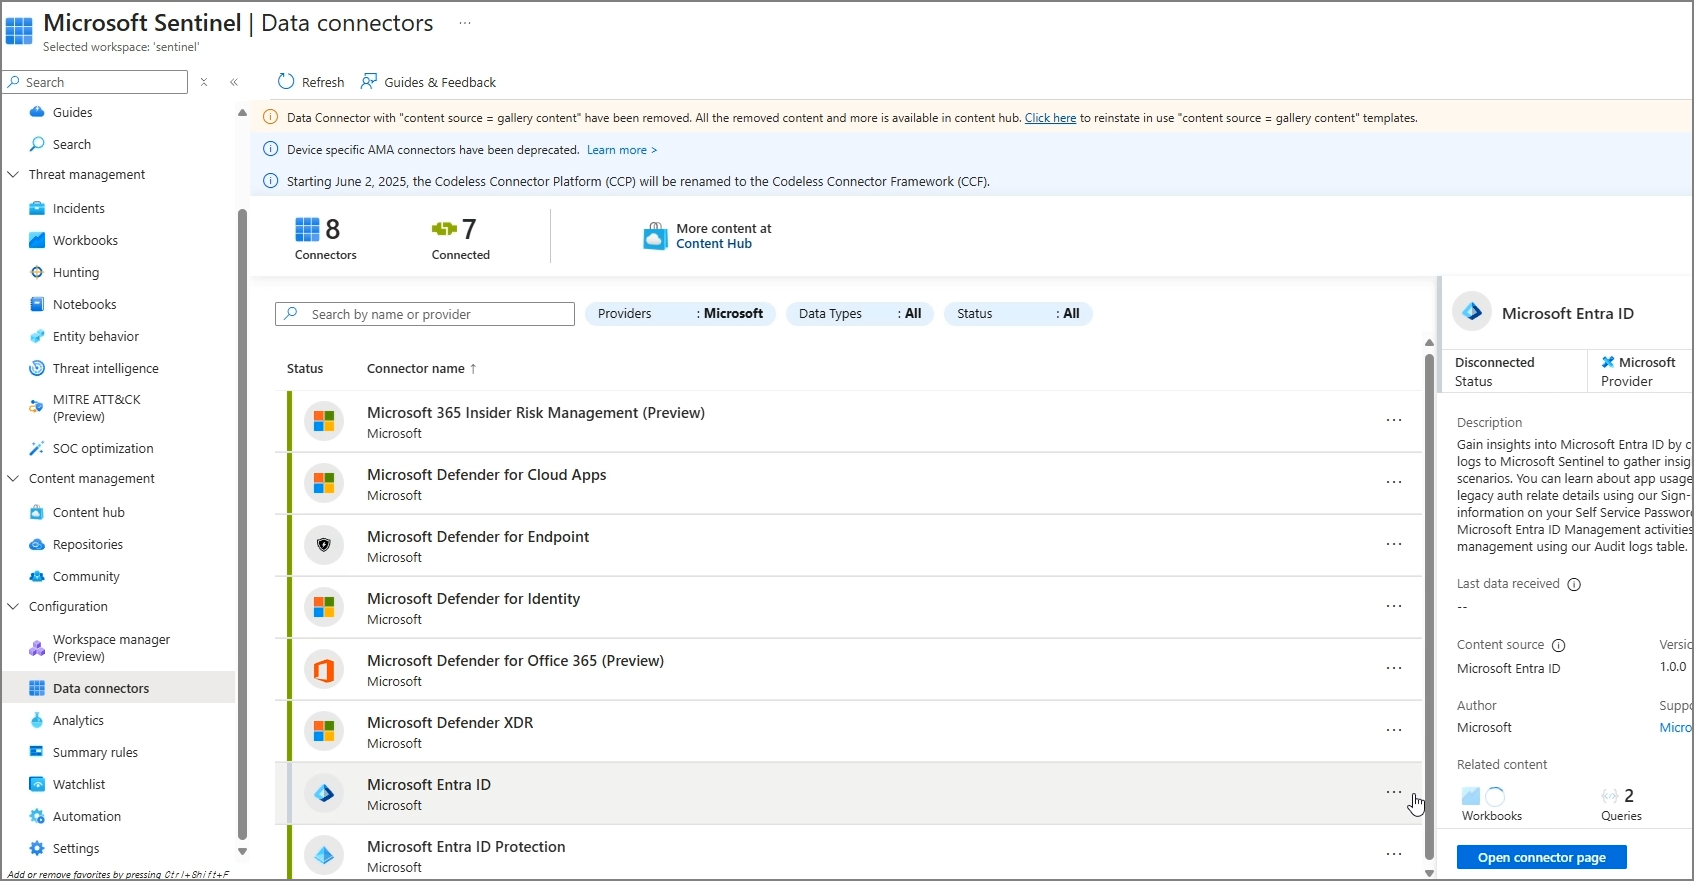
For a simple connection test, search for Microsoft Entra ID and proceed with the installation.
Data Connectors → Microsoft Entra ID → Open connector page
Select the logs to import and apply changes.
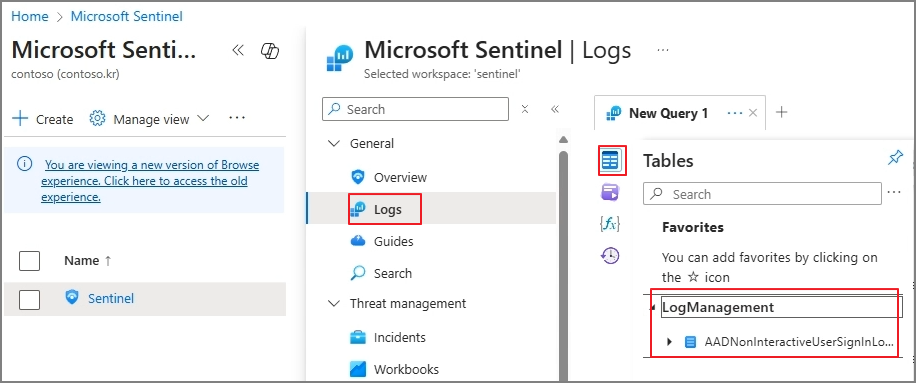
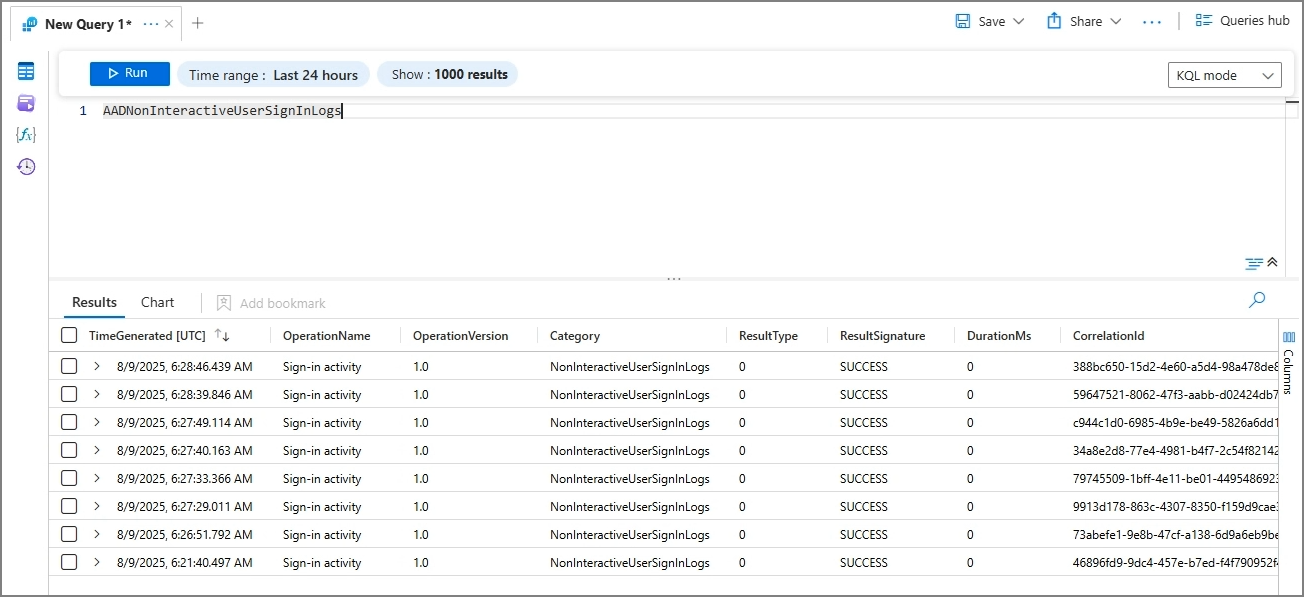
4. Verify Log Collection - Wait for logs to populate
- Use KQL mode to query and validate data ingestion
What’s Next?
In the next post, I’ll cover enabling specific Microsoft 365 logs and, if needed, the E5 onboarding process.
Tip: If you’re planning to integrate Sentinel with Microsoft 365, start small—enable core connectors first, then expand gradually.
In order to reduce confusion between Azure AD and Windows Server AD, Microsoft changed Azure AD to Entra ID, marking the beginning of the Entra product family.
Microsoft renamed Azure AD (Azure Active Directory) to Microsoft Entra ID to convey the product's multi-cloud, multi-platform capabilities, alleviate confusion with Windows Server Active Directory, and integrate it into the Microsoft Entra product family.
This change makes sense because the AD people are familiar with is actually Active Directory Domain Services (AD DS). To put it simply, Azure AD only manages identities, while policies for devices joined to Azure AD are managed by Intune's Configuration Profile. In other words, the cloud version of AD is a combination of Azure AD + Intune. It was difficult to explain this concept to those who have been accustomed to the traditional AD model for a long time.
By rebranding it as Entra, Microsoft is positioning it as a comprehensive identity and access management platform. When you access the Entra Management Center, you'll notice that it offers more features than when it was known as Azure AD.
Let's take a closer look at Verified ID. We will start with the following technical resource:
First, the background for the emergence of Verified ID is as follows:
In today’s world, our digital and physical lives are increasingly intertwined with the apps, services, and devices we use. This digital revolution opens up a world of possibilities, allowing us to connect with numerous companies and individuals in ways previously unimaginable.
However, with this increased connectivity comes a greater risk of identity theft and data breaches. These breaches can have significant impacts on both our personal and professional lives. But there is hope. Microsoft, in collaboration with various communities, has developed a decentralized identity solution that enables individuals to control their own digital identity, offering a secure and private way to manage identity data without relying on centralized authorities or intermediaries.
-> The key here is the Decentralized Identity solution. To be honest, the other concepts are a bit difficult for me to explain in more detail at my current level. Looking at this… if I had deep-dived into identity management alone, I probably wouldn’t have any trouble making a living.
I think I need to test how to use this practically and eventually gain a better understanding through hands-on experience.
Lead with open standards
Microsoft has implemented the following standards:
W3C Decentralized Identifier
W3C Verifiable Credentials
DIF Sidetree
DIF Well Known DID Configuration
DIF DID-SIOP
DIF Presentation Exchange
-> This suggests that it's not only something used in M365 but is a concept that can be integrated with other systems, similar to SSO or in a different capacity.
What is DID (Decentralized ID)?
DID is an identity management system where individuals, not central authorities or corporations, have direct control over the ownership and management of their identity information.
It ensures the integrity and security of identity information through a decentralized network rather than relying on central servers or institutions. Distributed ledger technologies, such as blockchain, are typically used, with the goal of giving individuals full control over their identity information.
So, what is Microsoft Verified ID? My understanding is that it plays the role of the issuer, verifier, and intermediary (Role Modeler).
The content explained by each item in the diagram is as follows:
1. W3C DID (Decentralized Identifier) Number
- A unique ID.
2. Trust System
- It verifies and authenticates to check DID documents.
3. MS Authenticate App
- Serves as a digital wallet. You can think of it like a wallet where the user stores their ID cards.
4. Microsoft Resolver
- An API that uses the did:web method to query and verify DIDs, returning the DDO (DID Document Object).
5. Microsoft Entra Verified ID API
- A REST API for issuing and verifying W3C Verifiable Credentials, signed using the did:web method, through Azure’s issuance and verification services.
In order to cover this flow in detail, it seems necessary to build a concrete sample environment to fully understand it.
Once I’ve built a sample, posted about it, and gained a reasonable understanding, I will update this post accordingly.
Continuing from the previous post, this time we will implement the functionality to compose and send emails using the Mail.Send permission of the Graph API.
We'll continue using the project created in the previous post.
The process pattern is somewhat established at this point:
Step 1: Add Mail.Send permission
Step 2: Create a ViewModel for sending emails
Step 3: Create a View for composing and sending emails
Step 4: Add the Action Method for sending emails
Step 1. Add Mail.Send permission
Appsettings.json
Add Mail.Send permission.
Step 2. Create a View Model for Sending Emails
Create the EmailSendViewModel to hold the data needed for sending emails. This model will include fields like recipient address, email subject, and email body.
Create the EmailSendViewModel class
public class EmailSendViewModel
{
public string To { get; set; } = string.Empty;
public string Subject { get; set; } = string.Empty;
public string Body { get; set; } = string.Empty;
}
Step 3. Create a View for Sending Emails
Create a view (SendEmail.cshtml) in the Views/Home directory, where users can compose and send emails. This view will use the EmailSendViewModel as its model.
Add the SendEmail action method to the HomeController. This method accepts EmailSendViewModel as a parameter and sends an email using the Microsoft Graph API.
Modify HomeController.cs.
Add the following content.
// GET action method to display the email sending form
[HttpGet]
public IActionResult SendEmail()
{
return View(new EmailSendViewModel()); // Pass an empty model to the view
}
// Sendemail
[HttpPost]
[AuthorizeForScopes(ScopeKeySection = "MicrosoftGraph:Scopes")]
public async Task<IActionResult> SendEmail(EmailSendViewModel model)
{
var message = new Message
{
Subject = model.Subject,
Body = new ItemBody
{
ContentType = BodyType.Text,
Content = model.Body
},
ToRecipients = new List<Recipient>()
{
new Recipient
{
EmailAddress = new EmailAddress
{
Address = model.To
}
}
}
};
await _graphServiceClient.Me.SendMail(message, null).Request().PostAsync();
return RedirectToAction("Index");
}