반응형

Previously, I covered how to export a Power BI M Query from Microsoft Sentinel and connect it to Power BI Desktop.

2025.08.24 - [Microsoft 365] - Microsoft 365 Log Management (2): Connecting MDI Logs to Sentinel and Power BI


While doing a self-study to compare Endpoint DLP logs against Microsoft Defender for Endpoint (MDE) logs, I ran into a practical issue: in Power BI, reorganizing column order can be surprisingly annoying when you just want to quickly compare a few fields side by side.


After digging in, I found a very handy trick:

✅ You can take the M Query exported from Sentinel/Log Analytics and paste it directly into Excel Power Query—and it works.


If you do analysis primarily in Excel (filters, quick comparisons, pivot tables), this approach is super practical.

So here’s the clean workflow:

“M Query export → Excel connection → analysis”


Youtube: https://youtu.be/iuyK1sINfzw


TL;DR

  • In Sentinel / Log Analytics, export your query using Export to Power BI (as an M query).
  • In Excel, open Power Query (Blank Query) and paste the M Query into the Advanced Editor.
  • Authenticate using Organizational account, then Close & Load to load it into a worksheet table.
  • From then on, just hit Refresh to update logs—no more re-running the same query in the portal.

Step 1) Export the M Query from Sentinel / Log Analytics

In the Azure Portal, navigate to either:

  • Microsoft Sentinel > Logs

  • Log Analytics Workspace > Logs


Write or select the query for the table > Setting Time range > Share > Export to Power BI (as an M query)


Step 2) Connect to Log Analytics Using M Query in Excel

2-1) Create a Blank Query

In Excel:

  • Data > Get Data > From Other Sources > Blank Query


2-2) Paste the M Query into Advanced Editor

In the Power Query Editor:

Open Advanced Editor


Paste the entire M Query you downloaded in Step 1 as-is

A typical exported M Query includes things like:

  • The target table
  • The query time range


✅ Pro tip: If you need to connect multiple tables, just duplicate the query and update only the table name and time span section. It’s the fastest way to scale your workbook.


2-3) Configure Credentials (Authentication)

On first connection, you may see Edit Credentials.


Organizational account → sign in → Connect


2-4) Load to Excel and Refresh Anytime

Before loading:

  • Rename the query to something meaningful
  • Then choose Close & Load to load into an Excel worksheet table

  • Use filters, sorting, pivots, conditional formatting, side-by-side comparisons… all the Excel stuff that’s great for fast investigation.


And the best part:

Refresh updates the dataset without re-running the whole process in the portal.


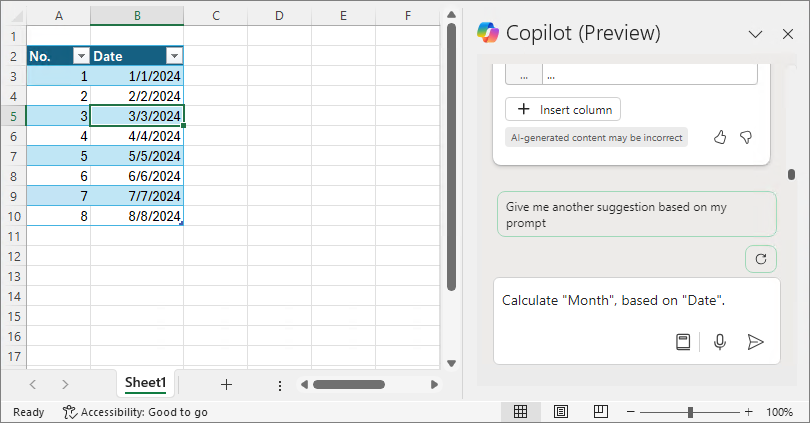
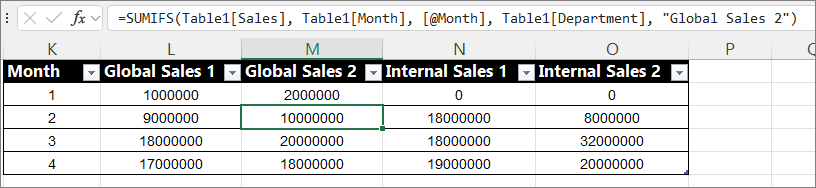
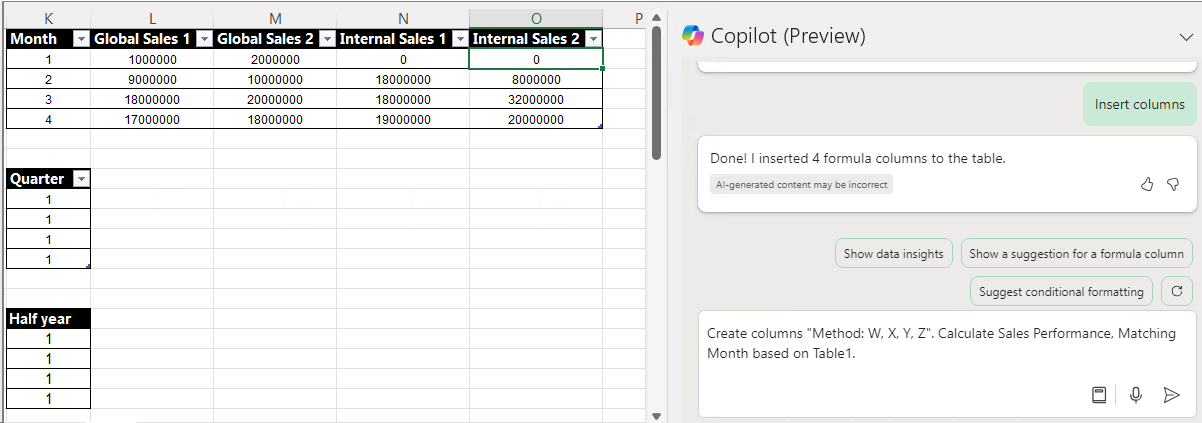
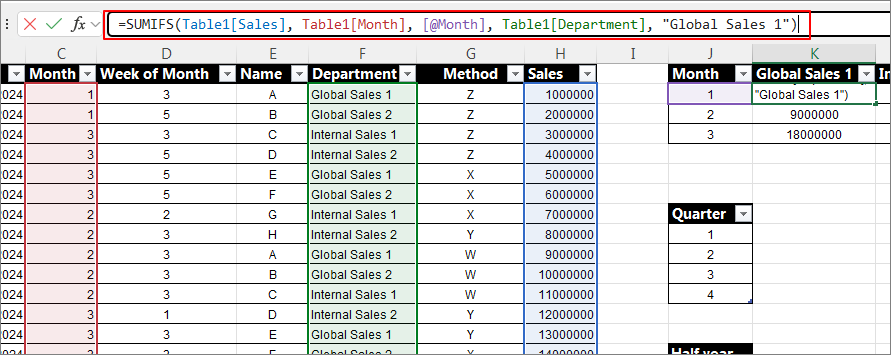
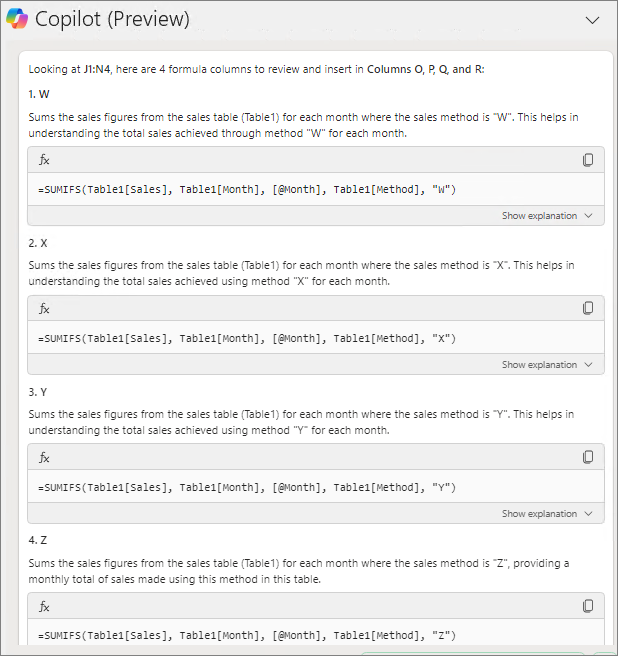
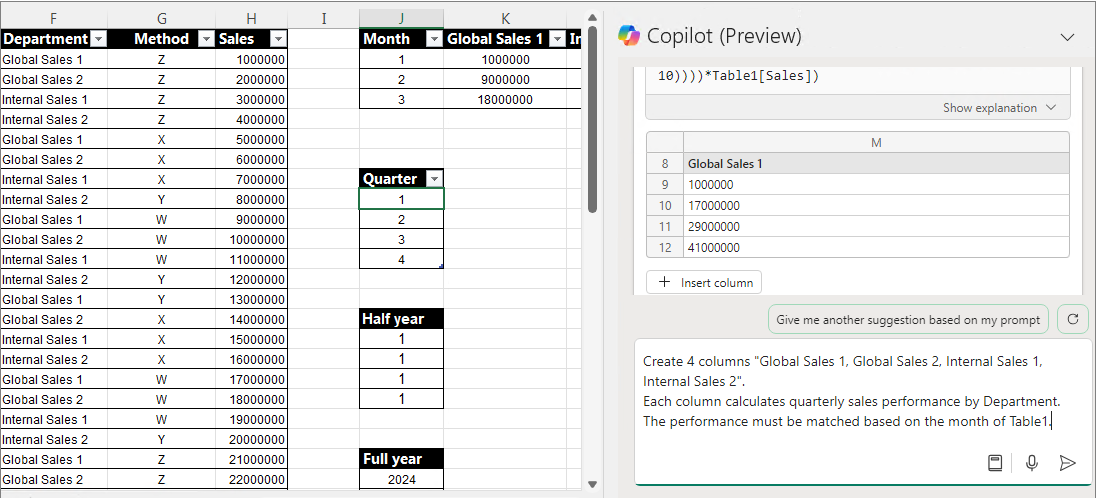
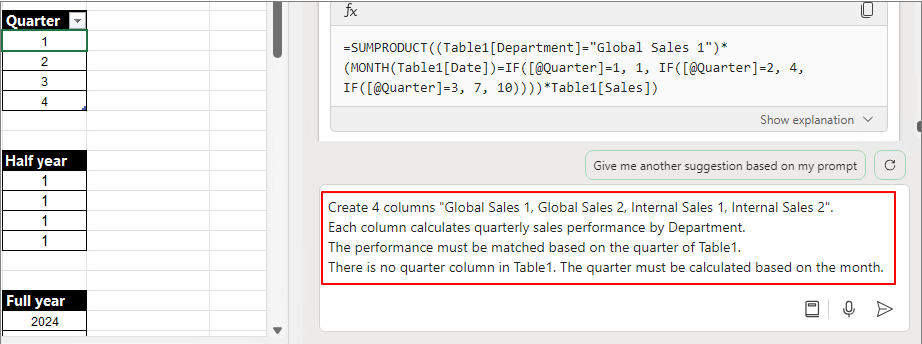
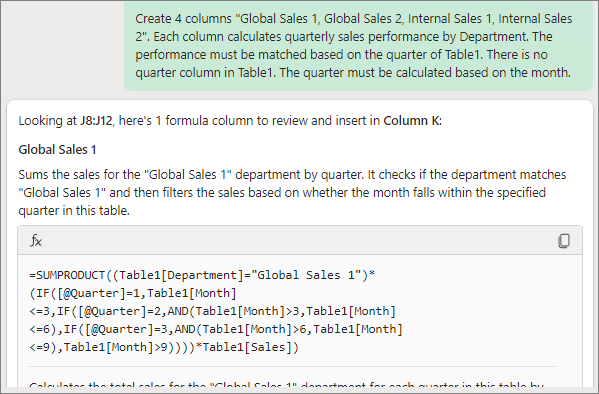
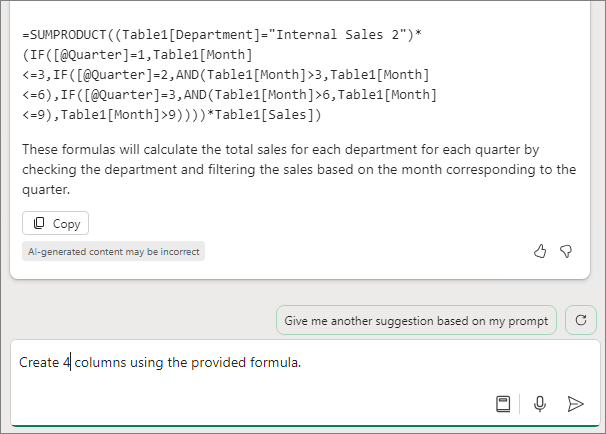
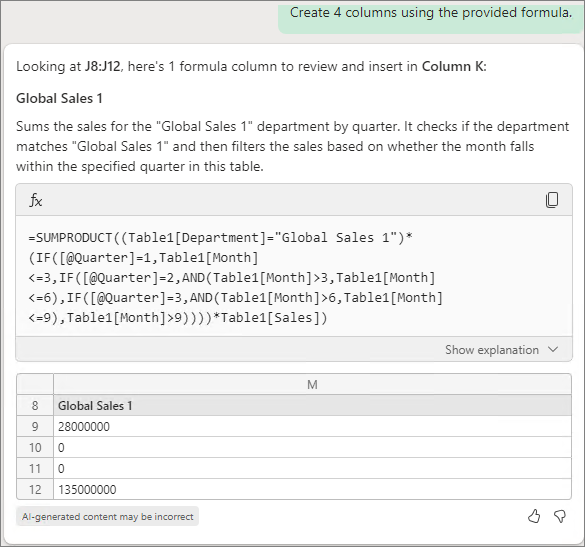
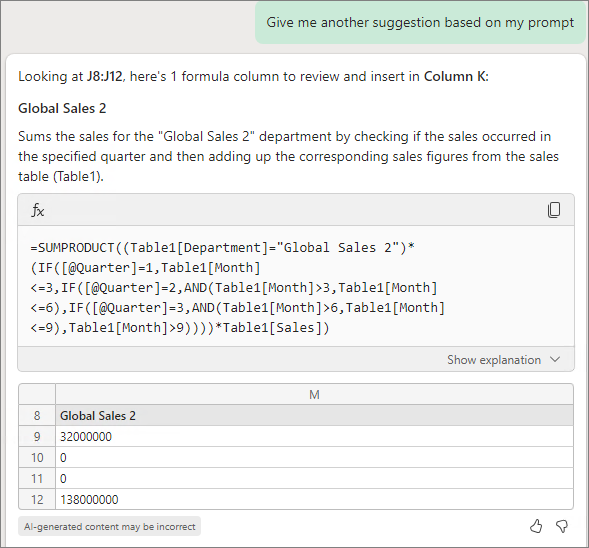
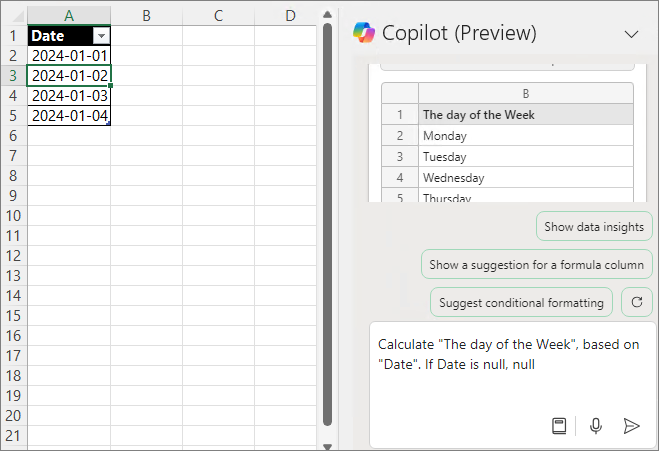
Step 3) Bonus: Analyze Logs with Copilot (Excel + OneDrive/SharePoint)

After loading logs into Excel:

  1. Save the workbook to OneDrive or SharePoint
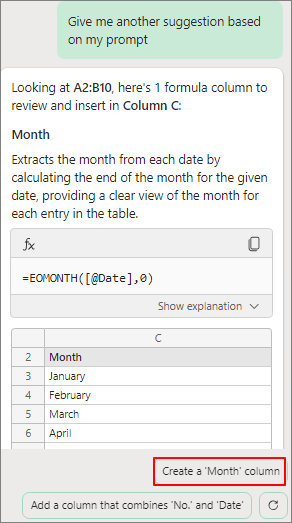
  2. Ask Copilot to analyze the data

If Copilot recognizes your tables (for example, MDE-related tables), it can quickly do things like:

  • Summaries
  • Trend analysis
  • Outlier/anomaly detection
  • Quick insights and narrative explanations

Wrap-up

Using M Query Export from Sentinel/Log Analytics isn’t just for Power BI—you can connect it directly to Excel and build a refreshable log analysis workbook.

If your workflow is centered on:

  • Fast comparison
  • Column reordering
  • Filtering
  • Pivot-based analysis

…then Excel can be the more efficient tool. And once the dataset is in OneDrive/SharePoint, Copilot becomes an extra boost for rapid investigation.

반응형
반응형

I have previously shown you how to add multiple rows simultaneously.


Copilot in Excel Series:

2024.07.27 - [Copilot] - Copilot in Excel: Useful Prompt (1). Calculate A, Matching B based on C (English)

2024.08.10 - [Copilot] - Copilot in Excel: Useful Prompt (2). Show data insights & Add all insights to grid (English)

2024.08.23 - [Copilot] - Copilot in Excel: Useful Prompt (3). If (Calculate condition) (English)

2024.09.08 - [Copilot] - Copilot in Excel: Useful Prompt (4). Add Columns (Multiple columns) (English)


https://youtu.be/2opOcZk9OqY


As I continue to research prompts, it seems that a request like "Create a column" is more appropriate than simply asking for calculations, so I plan to focus on that aspect.


Prompt 1. Create a "X" column

I started with the following prompt.

Calculate "Month", based on "Date".


I believe this has transformed into the following form.

Add a column Month. Calculate Month, based on Date.

= Add a Column Month based on Date

= Calculate "Month", based on "Date".

= Create a 'Month' column


Calculate "Month", based on "Date".


The first is presented as follows.


Give me another suggestion based on my prompt


Give me another suggestion based on my prompt


I think it might be a form where the beginning is omitted, as shown below.

 Add a column Month. Calculate Month, based on Date.


The previous prompt execution history might have an influence, but the prompt below produces almost the same result.

Add a column Month. Calculate Month, based on Date.

= Add a Column Month based on Date

= Calculate "Month", based on "Date".

= Create a 'Month' column


Prompt 2. Create columns "Title: A, B, C, D". Calculate Condition, Matching Month based on Table1.

As I input many prompts, there were many cases where the following prompt from a previous entry did not function as intended.


In particular, the following prompt did not produce the desired results in many cases.

Calculate Method W, X, Y, Z.  Matching Name, Quarter based on Table1


This time, I will proceed with a slight change. It has been confirmed that using the "Create Columns" prompt results in higher accuracy.

Create columns "Department: Global Sales 1, Global Sales 2, Internal Sales 1, Internal Sales 2". Calculate Sales Performance, Matching Month based on Table1.


Requesting to add the desired columns (up to a maximum of 4), along with additional explanations or examples, increases the accuracy.


Clicking "Hide explanation" allows you to check the explanation of the formula.


Check the results.


Let's proceed in the same pattern as follows.

Create columns "Method: W, X, Y, Z". Calculate Sales Performance, Matching Month based on Table1.


Check the formula explanation to ensure it matches the intended content.


It is confirmed that the 4 columns are added as intended.


Proceed with the addition and verify the results.


Prompt 3. Create 4 columns "A, B, C, D". Provide the basis, location, and definition regarding the requested matter.


There is no correct answer in prompts. The only solution is how well you present it for Copilot to understand. This time, I will try entering the prompt in a different way.


Create 4 columns "Global Sales 1, Global Sales 2, Internal Sales 1, Internal Sales 2".

Each column calculate monthly sales performance by Department.

The performance must be matched based on the month of Table1.


I will generate 4 columns.


Check if it aligns with my intended purpose.


Click on the formula to review it once more for confirmation.


Let's calculate the monthly sales performance by method using the same approach.


Create 4 columns "W, X, Y, X".

Each column calculate monthly sales performance by Method.

The performance must be matched based on the month of Table1.


It can be confirmed that the columns were generated following the same pattern.


Click on the formula to verify it.


It seems that calculating the quarter isn't working well. Pre-inserting the quarter into Table1 lowers the difficulty. Therefore, the structure of the Source Table is crucial when using Copilot.

Let's see what happens when we simply change "Monthly" to "Quarterly."


Create 4 columns "Global Sales 1, Global Sales 2, Internal Sales 1, Internal Sales 2".

Each column calculates quarterly sales performance by Department.

The performance must be matched based on the month of Table1.


Looking at the results, there is no part where the month is calculated as a quarter.


This time, I added more detailed explanations.

Create 4 columns "Global Sales 1, Global Sales 2, Internal Sales 1, Internal Sales 2".
Each column calculates quarterly sales performance by Department. 
The performance must be matched based on the quarter of Table1.
There is no quarter column in Table1. The quarter must be calculated based on the month.


It can be observed that the quarter definition was added and calculated correctly. However, only one column was added.


I want to create 4 columns


It only generates the formula.


Create 4 columns using the provided formula.


Still, the result was just one.


When proceeding as below, it suggests other columns. Calculating multiple rows felt quite challenging. Perhaps it's because this is still in the preview stage

Give me another suggestion based on my prompt


Give me another suggestion based on my prompt


By adding one at a time, I was able to complete it as shown below.


It would be great if things were clearer, but for now, offering various directions seems to be the best approach.

반응형
반응형

In the following post, when calculating some functions, I was able to include detailed conditions by using 'If'. This time, let's check to what extent the conditions are being met by using 'If'.


Related Posting

2024.07.27 - [Copilot] - Copilot in Excel: Useful Prompt (1). Calculate A, Matching B based on C (English)


Youtube

https://youtu.be/4Zs2W4otcJE


Prompt 1. If A is null, null

If you want to find the day of the week based on a date, you can input the prompt as follows.

Calculate "The day of the Week", based on "Date".


Formulate the equation as shown below.


If A is null, adding null results in the following:


Create it in the following format:


Null values are satisfied and calculated.

You can create various conditions with this pattern, such as for errors or incorrect formats.


Prompt 2. If A >= X, apply discount of Table (Apply the discount rate)

There is a sales invoice as shown below, and on the right, there is a discount rate table by product. Let's create the Amount by applying the conditions from the Discount_Table.


If Amount >= $2,000,000, apply discount of Discount_Table


Generate the formula as shown below.


You can see that the Discounted Amount is calculated as follows.


By applying this, it is expected that various invoices can be created more easily than before.


Prompt 3. Calculate "Target Achievement status". If Total Sales >= Target, "Success" or "Fail".

This time, as shown below, Table 1 contains sales records, Table 2 contains product performance, and Table 3 contains product targets


Calculate "Target Achievement status". If Total Sales >= Target, "Success" or "Fail".


Although Table 2 wasn't mentioned, it found the target from Table 2 and performed the calculation. It seems that the recent Excel Copilot remembers the prompts I gave earlier and uses them to generate formulas.


Result


As with other products, it appears that Copilot in Excel is significantly influenced by the Chat History.


Therefore, there are times when even a simple input is enough for it to reference and retrieve data, while other times, even with detailed instructions, it fails to generate the formula. I believe that the more you work with Copilot, the easier it becomes to create formulas efficiently.


Next Posting

2024.09.08 - [Copilot] - Copilot in Excel: Useful Prompt (4). Add Columns (Multiple columns) (English)

반응형
반응형

In a previous post,

2024.07.27 - [Copilot] - Copilot in Excel: Useful Prompt (1). Calculate A, Matching B based on C (English)


Let me introduce two useful prompts for creating pivot charts and pivot tables: "Show data insights" and "Add all insights to grid." These prompts are already quite well-known, but they are so helpful that I decided to include them in the "Useful Prompt" series. As this series grows longer, I believe that some people might eventually use it as a resource to organize their work.


https://youtu.be/SARDgdzV-Do


Prompt 1. Show data Insights

After selecting the table you want to analyze, click or input "Show data insights."


When you click "Add to a new sheet," the corresponding pivot chart and table will be generated on a new sheet. If you want to receive different data insights, click "Can I see another insight?"


When you click "Add to a new sheet," a simple prompt will generate the pivot chart and pivot table.


Prompt 2. Add all insights to grid

When you click "Add all insights to grid,"


various pivot charts and


pivot tables will be generated simultaneously.


Users who have struggled with creating pivot charts and pivot tables can now easily do so using simple prompts.

반응형

+ Recent posts