When troubleshooting in M365, it's common for administrators to use PowerShell for the process.
However, it raises the question of whether this really needs to be done within Copilot Studio. Nonetheless, I decided to write about it since there are tasks that occasionally require PowerShell.
This was carried out with reference to the technical documentation below.
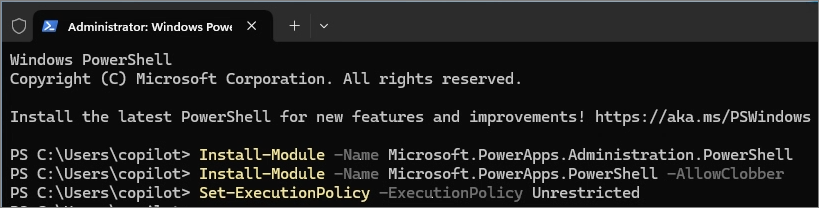
Since Power Apps and Power Automate are different areas, each requires a separate login.
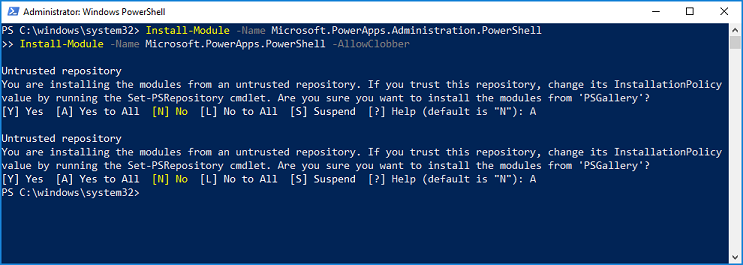
Unlike Exchange Online, there is no need to enter separate connection commands. Simply enter the command you wish to use, and it will prompt you to provide your credentials.
Enter the following command to connect to Power Apps:
Get-AdminPowerAppEnvironment
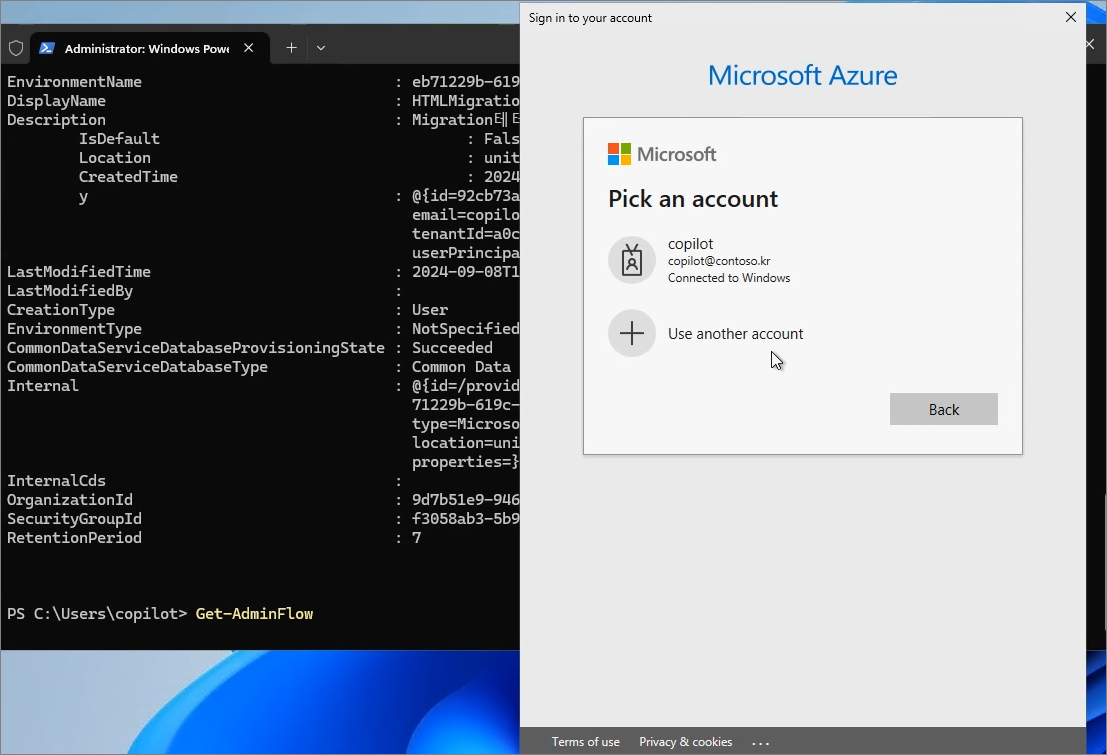
Enter the following command to connect to Power Automate:
Get-AdminFlow
In the future, if a PowerShell connection is needed for Copilot Studio, you can access and utilize it as required.
It took longer to write this post because the Copilot Studio page was not displaying in English.
From this experience, I learned a few things:
1. There is a difference between using English or not in Copilot Studio.
- Two-byte characters like Korean, in particular, could have an impact. It is recommended to test using English first and then check for differences in behavior when using the actual language of use.
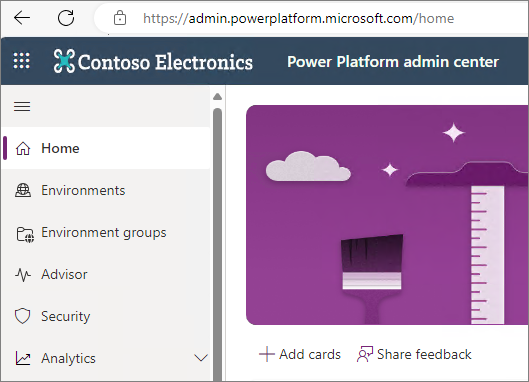
2. The default region of Power Platform is important. - Some regions do not support Copilot Studio. If you try to access https://copilotstudio.microsoft.com from these regions, an error will occur. In this case, you need to create an environment in the Power Platform Admin Center.
Copilot Studio is constantly evolving and changing.
So what is true today might change tomorrow.
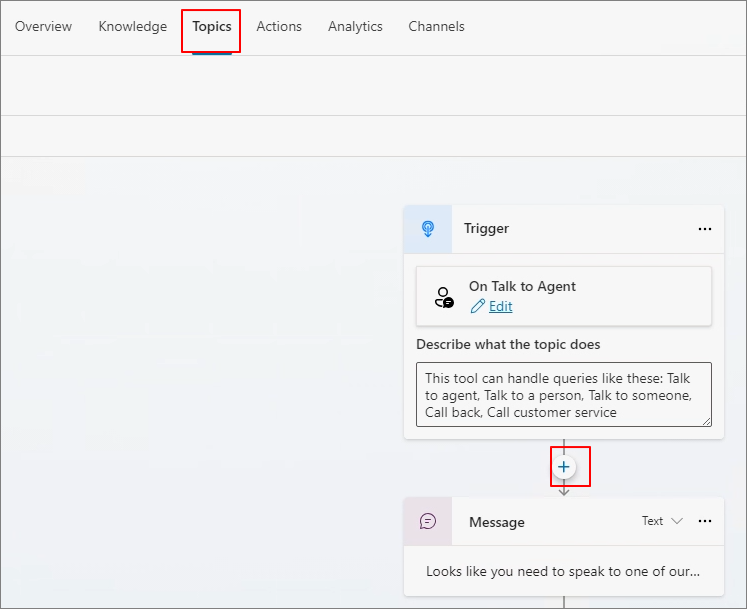
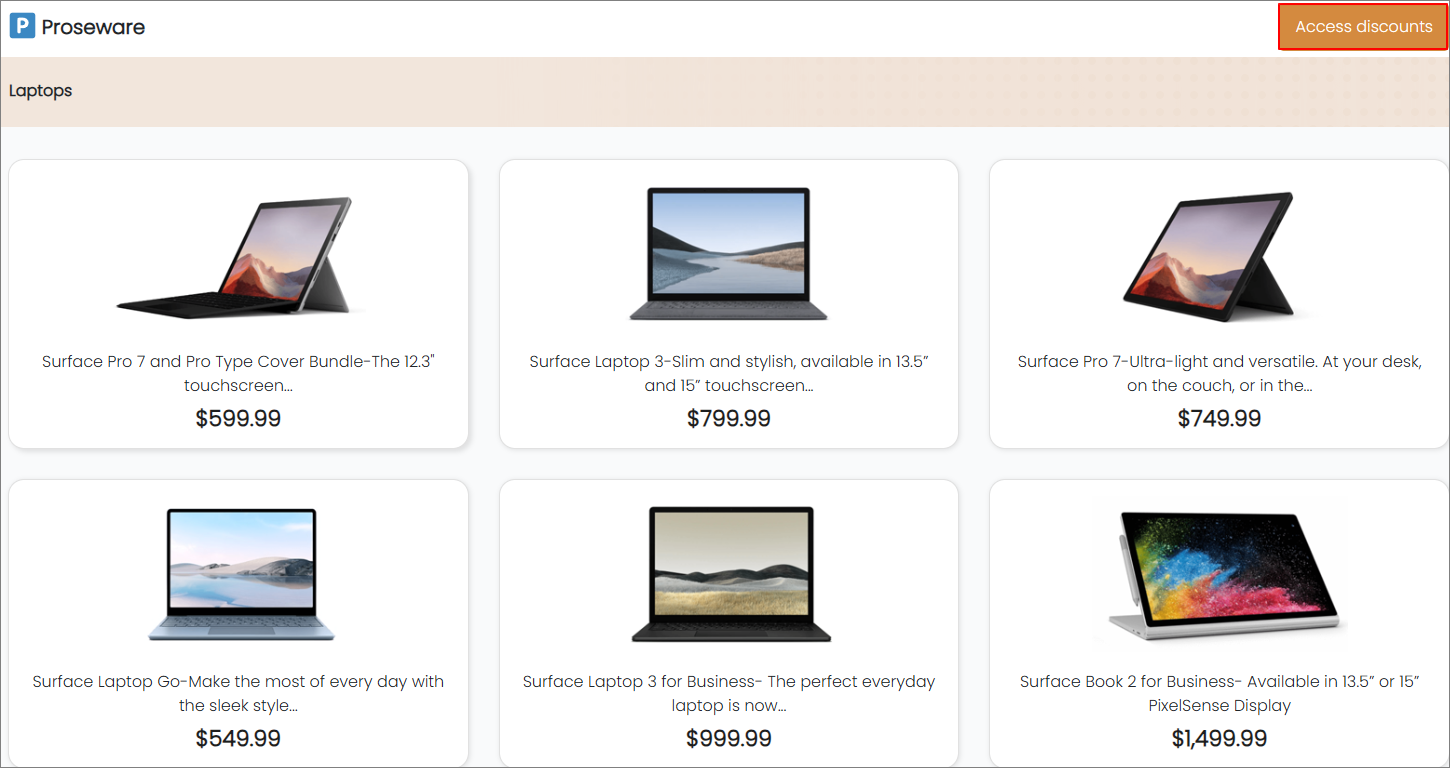
Let’s try creating a Copilot in Copilot Studio.
This Copilot is similar to what is commonly called a ChatBot. Some people even call it a "Custom Copilot."
The post was created with reference to the materials below.
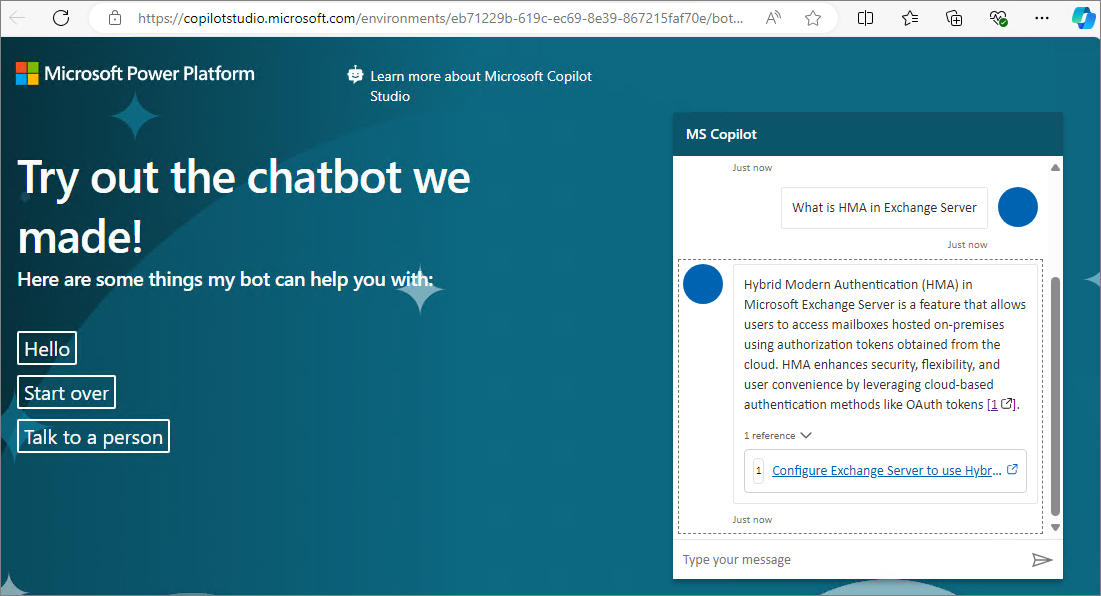
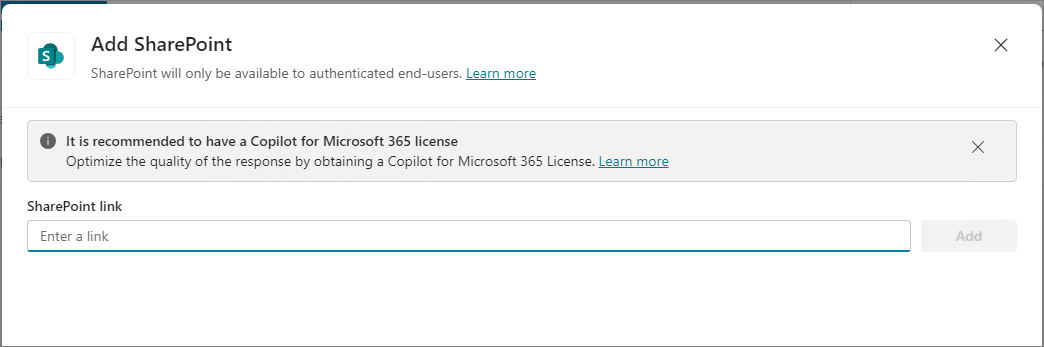
Enter a question in the Copilot test chat window on the right to verify that the response is accurate.
You can see that the responses reference content from the MS Learn site.
Settings in the upper right corner.
You can select generative AI responses from the Generative AI menu. This menu is also only available in certain languages.
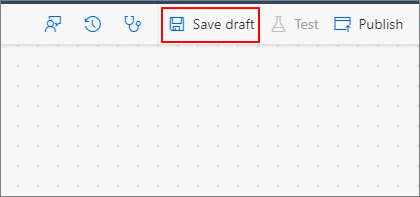
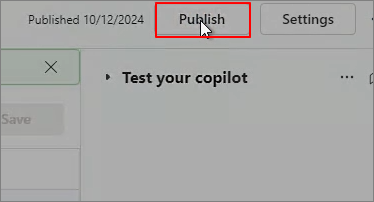
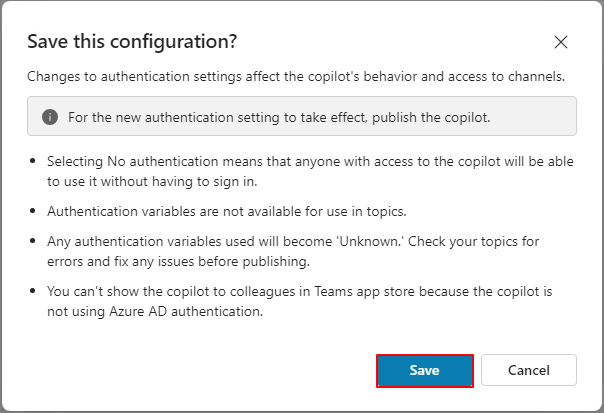
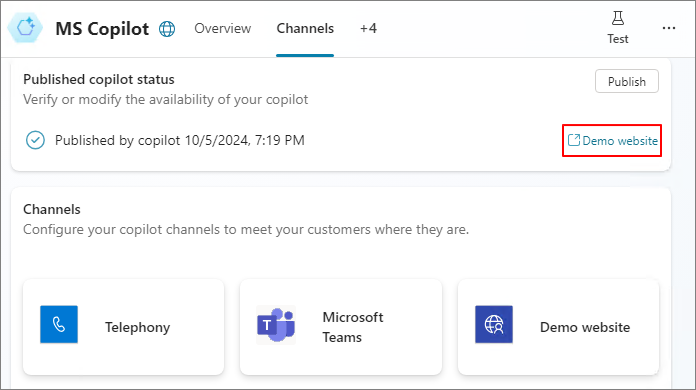
Publish
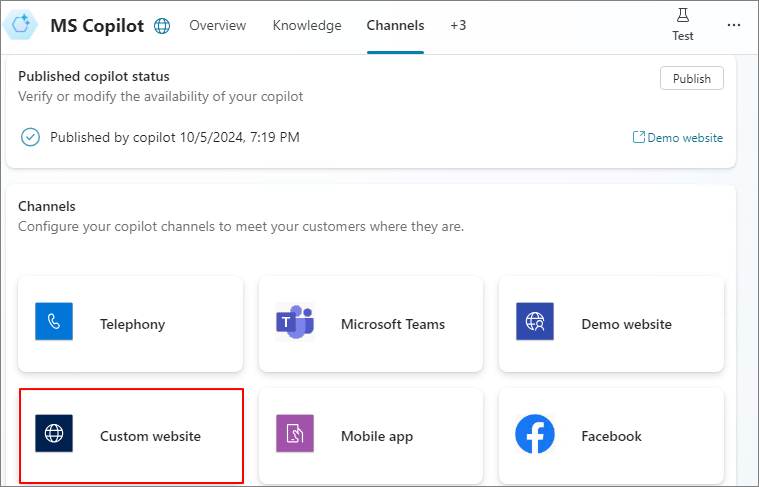
I will deploy it so that users can use it in Teams.
Channels at the top -> Microsoft Teams
When you click Open, it will run directly in Teams. If you click Availability options,
You can choose sharing or deployment options.
Click Open in the previous menu to run Copilot in Teams. Select Add or Open.
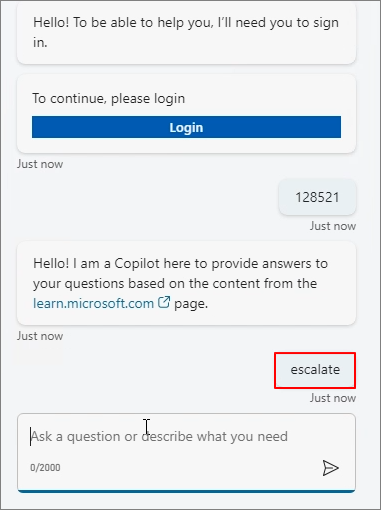
Ask the Copilot ChatBot questions just like you did during the test.
So, what’s the advantage of using it this way? You might have this question.
The benefit is that you can receive precise answers based on the content of a specific site. BizChat generates fairly good responses. However, since it provides answers based on the Bing engine and references various sources like Wiki and blogs, its accuracy can be lower.
In order to reduce confusion between Azure AD and Windows Server AD, Microsoft changed Azure AD to Entra ID, marking the beginning of the Entra product family.
Microsoft renamed Azure AD (Azure Active Directory) to Microsoft Entra ID to convey the product's multi-cloud, multi-platform capabilities, alleviate confusion with Windows Server Active Directory, and integrate it into the Microsoft Entra product family.
This change makes sense because the AD people are familiar with is actually Active Directory Domain Services (AD DS). To put it simply, Azure AD only manages identities, while policies for devices joined to Azure AD are managed by Intune's Configuration Profile. In other words, the cloud version of AD is a combination of Azure AD + Intune. It was difficult to explain this concept to those who have been accustomed to the traditional AD model for a long time.
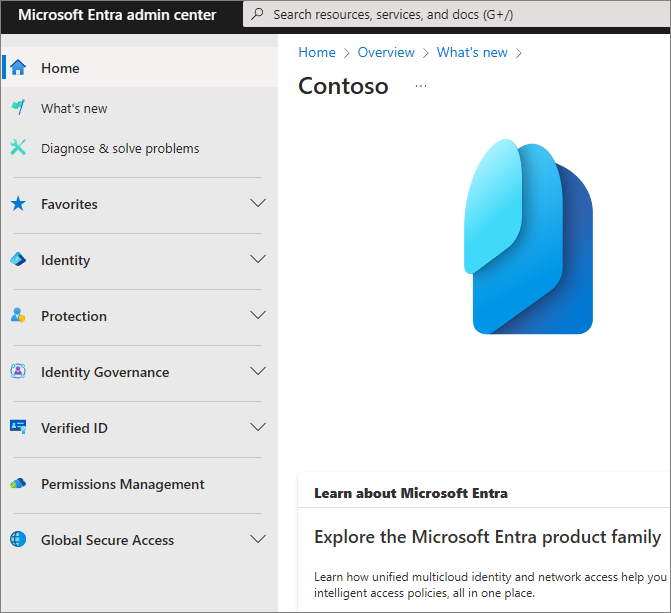
By rebranding it as Entra, Microsoft is positioning it as a comprehensive identity and access management platform. When you access the Entra Management Center, you'll notice that it offers more features than when it was known as Azure AD.
Let's take a closer look at Verified ID. We will start with the following technical resource:
First, the background for the emergence of Verified ID is as follows:
In today’s world, our digital and physical lives are increasingly intertwined with the apps, services, and devices we use. This digital revolution opens up a world of possibilities, allowing us to connect with numerous companies and individuals in ways previously unimaginable.
However, with this increased connectivity comes a greater risk of identity theft and data breaches. These breaches can have significant impacts on both our personal and professional lives. But there is hope. Microsoft, in collaboration with various communities, has developed a decentralized identity solution that enables individuals to control their own digital identity, offering a secure and private way to manage identity data without relying on centralized authorities or intermediaries.
-> The key here is the Decentralized Identity solution. To be honest, the other concepts are a bit difficult for me to explain in more detail at my current level. Looking at this… if I had deep-dived into identity management alone, I probably wouldn’t have any trouble making a living.
I think I need to test how to use this practically and eventually gain a better understanding through hands-on experience.
Lead with open standards
Microsoft has implemented the following standards:
W3C Decentralized Identifier
W3C Verifiable Credentials
DIF Sidetree
DIF Well Known DID Configuration
DIF DID-SIOP
DIF Presentation Exchange
-> This suggests that it's not only something used in M365 but is a concept that can be integrated with other systems, similar to SSO or in a different capacity.
What is DID (Decentralized ID)?
DID is an identity management system where individuals, not central authorities or corporations, have direct control over the ownership and management of their identity information.
It ensures the integrity and security of identity information through a decentralized network rather than relying on central servers or institutions. Distributed ledger technologies, such as blockchain, are typically used, with the goal of giving individuals full control over their identity information.
So, what is Microsoft Verified ID? My understanding is that it plays the role of the issuer, verifier, and intermediary (Role Modeler).
The content explained by each item in the diagram is as follows:
1. W3C DID (Decentralized Identifier) Number
- A unique ID.
2. Trust System
- It verifies and authenticates to check DID documents.
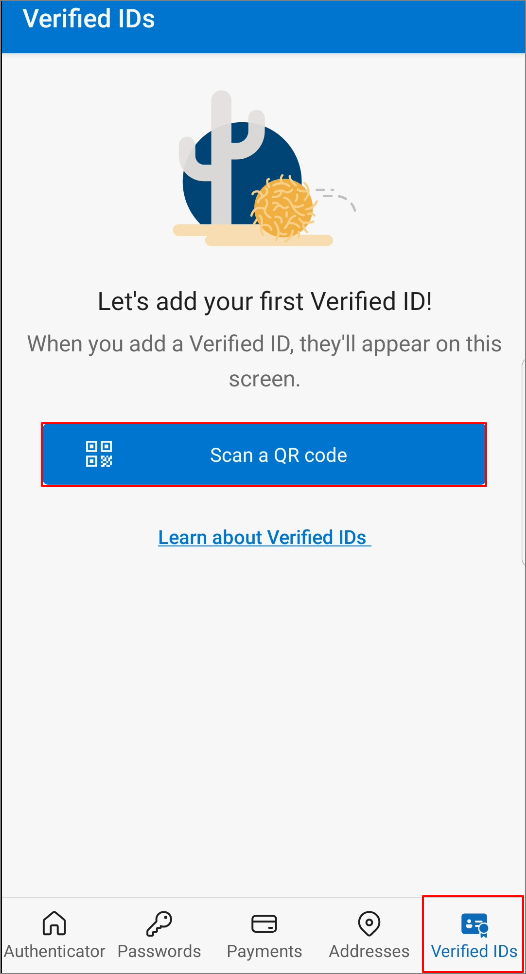
3. MS Authenticate App
- Serves as a digital wallet. You can think of it like a wallet where the user stores their ID cards.
4. Microsoft Resolver
- An API that uses the did:web method to query and verify DIDs, returning the DDO (DID Document Object).
5. Microsoft Entra Verified ID API
- A REST API for issuing and verifying W3C Verifiable Credentials, signed using the did:web method, through Azure’s issuance and verification services.
In order to cover this flow in detail, it seems necessary to build a concrete sample environment to fully understand it.
Once I’ve built a sample, posted about it, and gained a reasonable understanding, I will update this post accordingly.